Immigrants from Costa Rica vs Barbadian Disability Age Under 5
COMPARE
Immigrants from Costa Rica
Barbadian
Disability Age Under 5
Disability Age Under 5 Comparison
Immigrants from Costa Rica
Barbadians
1.3%
DISABILITY AGE UNDER 5
5.5/ 100
METRIC RATING
229th/ 347
METRIC RANK
1.0%
DISABILITY AGE UNDER 5
99.9/ 100
METRIC RATING
35th/ 347
METRIC RANK
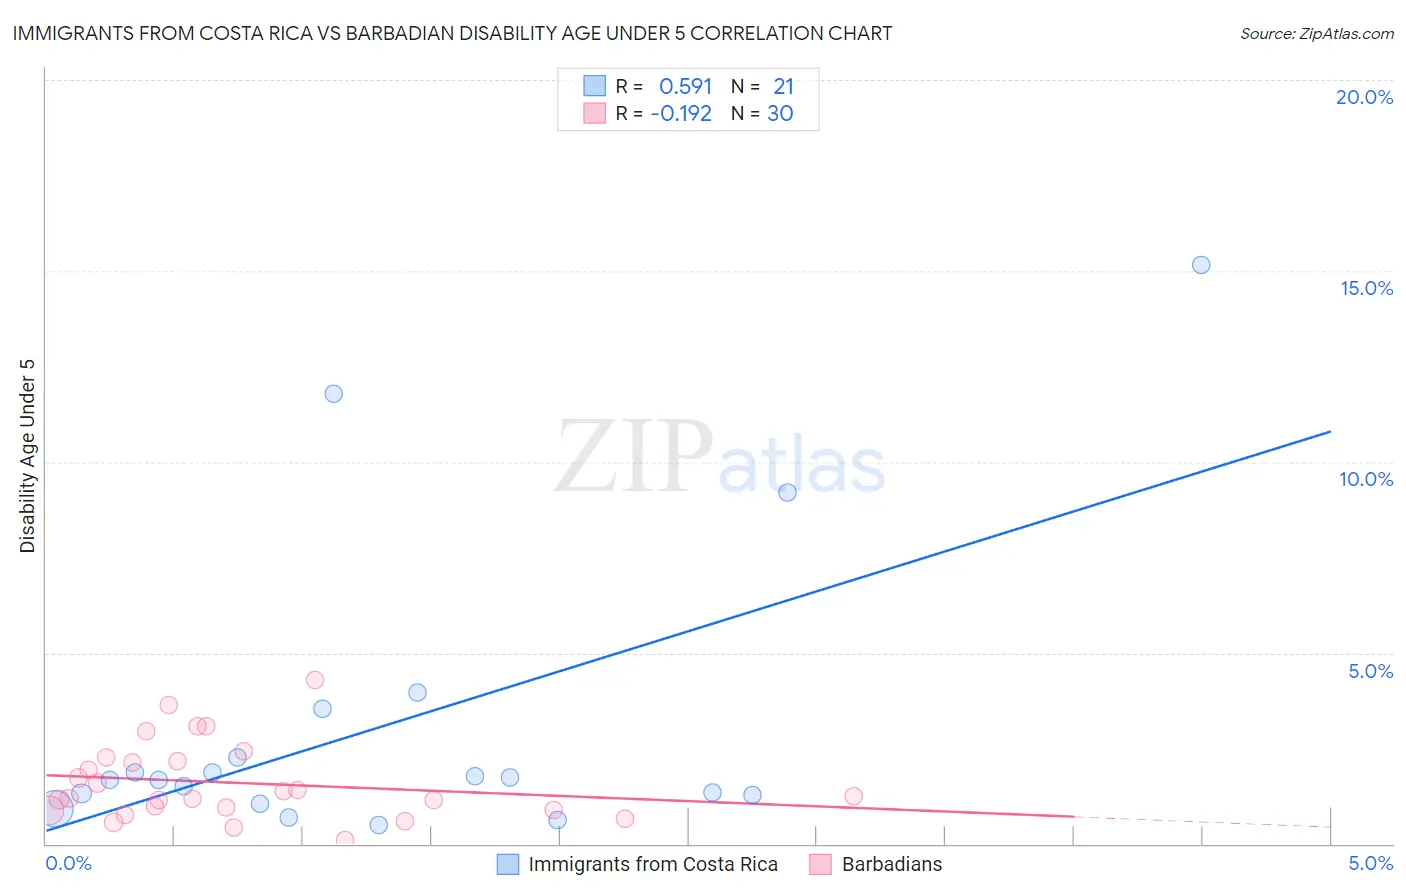
Immigrants from Costa Rica vs Barbadian Disability Age Under 5 Correlation Chart
The statistical analysis conducted on geographies consisting of 133,028,674 people shows a substantial positive correlation between the proportion of Immigrants from Costa Rica and percentage of population with a disability under the age of 5 in the United States with a correlation coefficient (R) of 0.591 and weighted average of 1.3%. Similarly, the statistical analysis conducted on geographies consisting of 100,337,309 people shows a poor negative correlation between the proportion of Barbadians and percentage of population with a disability under the age of 5 in the United States with a correlation coefficient (R) of -0.192 and weighted average of 1.0%, a difference of 27.3%.
Disability Age Under 5 Correlation Summary
| Measurement | Immigrants from Costa Rica | Barbadian |
| Minimum | 0.49% | 0.086% |
| Maximum | 15.2% | 4.3% |
| Range | 14.7% | 4.2% |
| Mean | 3.1% | 1.6% |
| Median | 1.7% | 1.2% |
| Interquartile 25% (IQ1) | 1.2% | 0.89% |
| Interquartile 75% (IQ3) | 2.9% | 2.2% |
| Interquartile Range (IQR) | 1.7% | 1.3% |
| Standard Deviation (Sample) | 3.9% | 1.0% |
| Standard Deviation (Population) | 3.8% | 1.00% |
Similar Demographics by Disability Age Under 5
Demographics Similar to Immigrants from Costa Rica by Disability Age Under 5
In terms of disability age under 5, the demographic groups most similar to Immigrants from Costa Rica are Lebanese (1.3%, a difference of 0.10%), Luxembourger (1.3%, a difference of 0.21%), Taiwanese (1.3%, a difference of 0.23%), Immigrants from Northern Europe (1.3%, a difference of 0.34%), and French American Indian (1.3%, a difference of 0.47%).
| Demographics | Rating | Rank | Disability Age Under 5 |
| Ukrainians | 8.3 /100 | #222 | Tragic 1.3% |
| Hispanics or Latinos | 7.7 /100 | #223 | Tragic 1.3% |
| Latvians | 7.1 /100 | #224 | Tragic 1.3% |
| Panamanians | 7.1 /100 | #225 | Tragic 1.3% |
| Bahamians | 7.1 /100 | #226 | Tragic 1.3% |
| Taiwanese | 6.1 /100 | #227 | Tragic 1.3% |
| Luxembourgers | 6.1 /100 | #228 | Tragic 1.3% |
| Immigrants | Costa Rica | 5.5 /100 | #229 | Tragic 1.3% |
| Lebanese | 5.3 /100 | #230 | Tragic 1.3% |
| Immigrants | Northern Europe | 4.7 /100 | #231 | Tragic 1.3% |
| French American Indians | 4.5 /100 | #232 | Tragic 1.3% |
| Tongans | 4.2 /100 | #233 | Tragic 1.3% |
| Pueblo | 3.8 /100 | #234 | Tragic 1.3% |
| Central American Indians | 3.6 /100 | #235 | Tragic 1.3% |
| South American Indians | 3.3 /100 | #236 | Tragic 1.3% |
Demographics Similar to Barbadians by Disability Age Under 5
In terms of disability age under 5, the demographic groups most similar to Barbadians are Immigrants from Ukraine (1.0%, a difference of 0.24%), Bolivian (1.0%, a difference of 0.36%), Iranian (1.0%, a difference of 0.53%), Armenian (1.0%, a difference of 0.58%), and Immigrants from Nepal (1.0%, a difference of 0.71%).
| Demographics | Rating | Rank | Disability Age Under 5 |
| Immigrants | Eastern Asia | 100.0 /100 | #28 | Exceptional 1.0% |
| Immigrants | Belarus | 100.0 /100 | #29 | Exceptional 1.0% |
| Immigrants | South Central Asia | 99.9 /100 | #30 | Exceptional 1.0% |
| Armenians | 99.9 /100 | #31 | Exceptional 1.0% |
| Iranians | 99.9 /100 | #32 | Exceptional 1.0% |
| Bolivians | 99.9 /100 | #33 | Exceptional 1.0% |
| Immigrants | Ukraine | 99.9 /100 | #34 | Exceptional 1.0% |
| Barbadians | 99.9 /100 | #35 | Exceptional 1.0% |
| Immigrants | Nepal | 99.9 /100 | #36 | Exceptional 1.0% |
| Immigrants | India | 99.9 /100 | #37 | Exceptional 1.0% |
| Immigrants | Guyana | 99.9 /100 | #38 | Exceptional 1.0% |
| Filipinos | 99.9 /100 | #39 | Exceptional 1.1% |
| Immigrants | Albania | 99.9 /100 | #40 | Exceptional 1.1% |
| Thais | 99.8 /100 | #41 | Exceptional 1.1% |
| Immigrants | Bulgaria | 99.8 /100 | #42 | Exceptional 1.1% |