Nigerian vs Peruvian Disability Age 5 to 17
COMPARE
Nigerian
Peruvian
Disability Age 5 to 17
Disability Age 5 to 17 Comparison
Nigerians
Peruvians
5.8%
DISABILITY AGE 5 TO 17
7.5/ 100
METRIC RATING
216th/ 347
METRIC RANK
5.3%
DISABILITY AGE 5 TO 17
98.5/ 100
METRIC RATING
104th/ 347
METRIC RANK
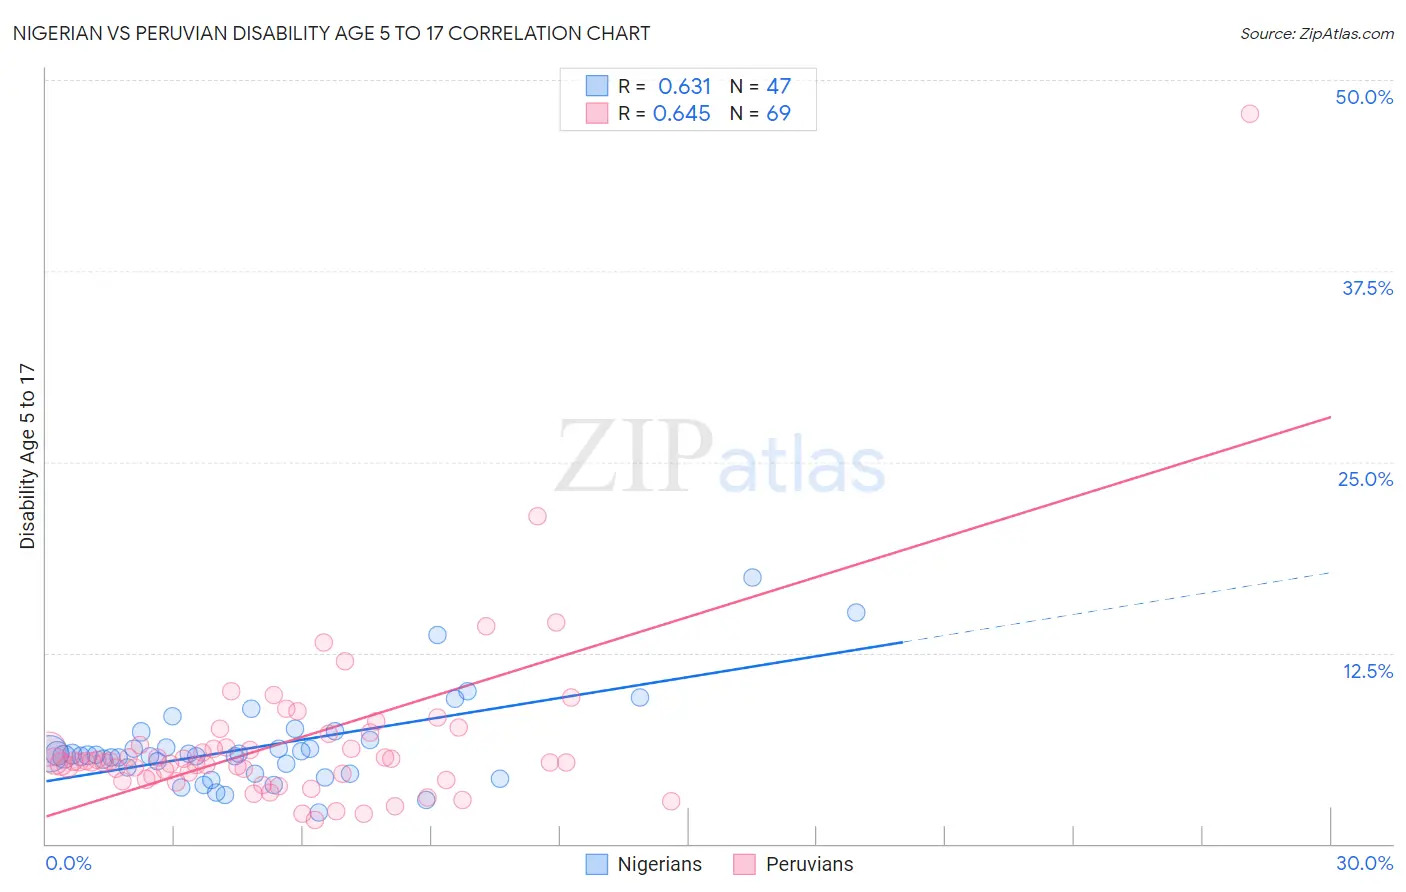
Nigerian vs Peruvian Disability Age 5 to 17 Correlation Chart
The statistical analysis conducted on geographies consisting of 330,899,838 people shows a significant positive correlation between the proportion of Nigerians and percentage of population with a disability between the ages 5 and 17 in the United States with a correlation coefficient (R) of 0.631 and weighted average of 5.8%. Similarly, the statistical analysis conducted on geographies consisting of 360,719,840 people shows a significant positive correlation between the proportion of Peruvians and percentage of population with a disability between the ages 5 and 17 in the United States with a correlation coefficient (R) of 0.645 and weighted average of 5.3%, a difference of 8.7%.
Disability Age 5 to 17 Correlation Summary
| Measurement | Nigerian | Peruvian |
| Minimum | 2.1% | 1.6% |
| Maximum | 17.5% | 47.8% |
| Range | 15.4% | 46.2% |
| Mean | 6.4% | 6.6% |
| Median | 5.8% | 5.4% |
| Interquartile 25% (IQ1) | 4.6% | 4.3% |
| Interquartile 75% (IQ3) | 6.8% | 6.8% |
| Interquartile Range (IQR) | 2.2% | 2.5% |
| Standard Deviation (Sample) | 2.9% | 6.0% |
| Standard Deviation (Population) | 2.9% | 5.9% |
Similar Demographics by Disability Age 5 to 17
Demographics Similar to Nigerians by Disability Age 5 to 17
In terms of disability age 5 to 17, the demographic groups most similar to Nigerians are Czech (5.8%, a difference of 0.030%), Immigrants from Sierra Leone (5.8%, a difference of 0.080%), Swedish (5.8%, a difference of 0.090%), Sierra Leonean (5.8%, a difference of 0.090%), and Belgian (5.8%, a difference of 0.10%).
| Demographics | Rating | Rank | Disability Age 5 to 17 |
| Immigrants | Uganda | 9.7 /100 | #209 | Tragic 5.8% |
| Immigrants | Haiti | 9.5 /100 | #210 | Tragic 5.8% |
| Yugoslavians | 9.1 /100 | #211 | Tragic 5.8% |
| Immigrants | Panama | 8.7 /100 | #212 | Tragic 5.8% |
| Immigrants | Cameroon | 8.3 /100 | #213 | Tragic 5.8% |
| Immigrants | Morocco | 8.3 /100 | #214 | Tragic 5.8% |
| Swedes | 8.1 /100 | #215 | Tragic 5.8% |
| Nigerians | 7.5 /100 | #216 | Tragic 5.8% |
| Czechs | 7.4 /100 | #217 | Tragic 5.8% |
| Immigrants | Sierra Leone | 7.1 /100 | #218 | Tragic 5.8% |
| Sierra Leoneans | 7.0 /100 | #219 | Tragic 5.8% |
| Belgians | 6.9 /100 | #220 | Tragic 5.8% |
| Lithuanians | 6.7 /100 | #221 | Tragic 5.8% |
| Immigrants | Sudan | 6.7 /100 | #222 | Tragic 5.8% |
| Alsatians | 6.0 /100 | #223 | Tragic 5.8% |
Demographics Similar to Peruvians by Disability Age 5 to 17
In terms of disability age 5 to 17, the demographic groups most similar to Peruvians are Salvadoran (5.3%, a difference of 0.070%), Immigrants from Italy (5.3%, a difference of 0.090%), Nicaraguan (5.3%, a difference of 0.10%), Menominee (5.3%, a difference of 0.18%), and Nepalese (5.3%, a difference of 0.20%).
| Demographics | Rating | Rank | Disability Age 5 to 17 |
| Immigrants | Europe | 99.0 /100 | #97 | Exceptional 5.3% |
| Immigrants | Austria | 98.9 /100 | #98 | Exceptional 5.3% |
| Cambodians | 98.8 /100 | #99 | Exceptional 5.3% |
| Nepalese | 98.7 /100 | #100 | Exceptional 5.3% |
| Menominee | 98.7 /100 | #101 | Exceptional 5.3% |
| Nicaraguans | 98.6 /100 | #102 | Exceptional 5.3% |
| Salvadorans | 98.6 /100 | #103 | Exceptional 5.3% |
| Peruvians | 98.5 /100 | #104 | Exceptional 5.3% |
| Immigrants | Italy | 98.4 /100 | #105 | Exceptional 5.3% |
| Immigrants | Yemen | 98.2 /100 | #106 | Exceptional 5.3% |
| Russians | 98.2 /100 | #107 | Exceptional 5.3% |
| Immigrants | South Africa | 98.1 /100 | #108 | Exceptional 5.3% |
| Immigrants | Northern Africa | 98.1 /100 | #109 | Exceptional 5.3% |
| Immigrants | Eritrea | 98.0 /100 | #110 | Exceptional 5.3% |
| Ethiopians | 97.9 /100 | #111 | Exceptional 5.3% |