Bulgarian vs Central American Indian Male Disability
COMPARE
Bulgarian
Central American Indian
Male Disability
Male Disability Comparison
Bulgarians
Central American Indians
10.6%
MALE DISABILITY
98.1/ 100
METRIC RATING
84th/ 347
METRIC RANK
12.7%
MALE DISABILITY
0.0/ 100
METRIC RATING
278th/ 347
METRIC RANK
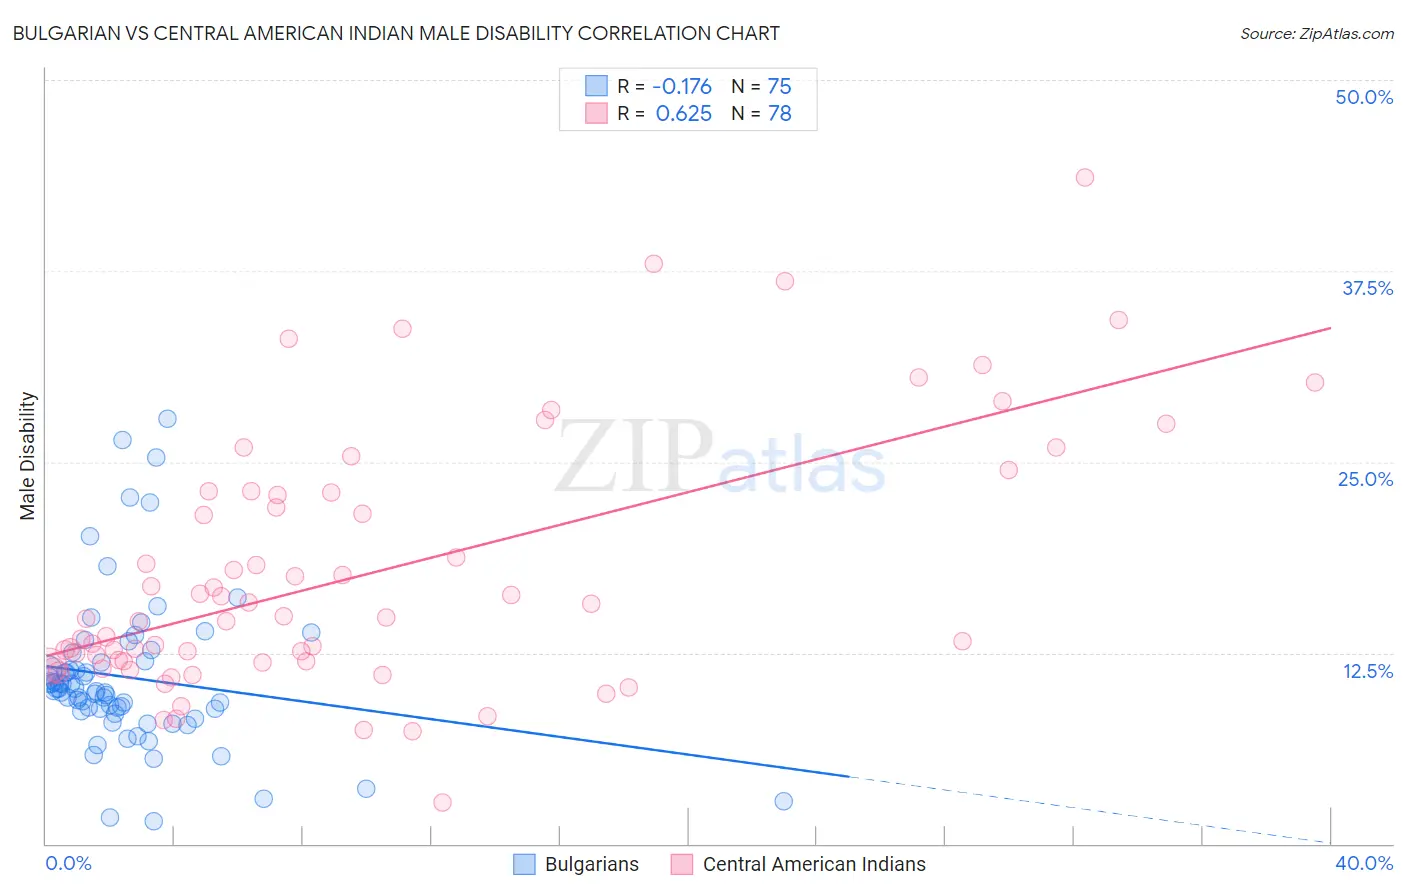
Bulgarian vs Central American Indian Male Disability Correlation Chart
The statistical analysis conducted on geographies consisting of 205,628,995 people shows a poor negative correlation between the proportion of Bulgarians and percentage of males with a disability in the United States with a correlation coefficient (R) of -0.176 and weighted average of 10.6%. Similarly, the statistical analysis conducted on geographies consisting of 326,112,546 people shows a significant positive correlation between the proportion of Central American Indians and percentage of males with a disability in the United States with a correlation coefficient (R) of 0.625 and weighted average of 12.7%, a difference of 19.5%.
Male Disability Correlation Summary
| Measurement | Bulgarian | Central American Indian |
| Minimum | 1.5% | 2.7% |
| Maximum | 27.8% | 43.7% |
| Range | 26.4% | 40.9% |
| Mean | 10.9% | 17.7% |
| Median | 10.0% | 14.8% |
| Interquartile 25% (IQ1) | 8.7% | 11.9% |
| Interquartile 75% (IQ3) | 11.9% | 23.0% |
| Interquartile Range (IQR) | 3.2% | 11.0% |
| Standard Deviation (Sample) | 5.0% | 8.4% |
| Standard Deviation (Population) | 5.0% | 8.3% |
Similar Demographics by Male Disability
Demographics Similar to Bulgarians by Male Disability
In terms of male disability, the demographic groups most similar to Bulgarians are Immigrants from Poland (10.6%, a difference of 0.010%), Immigrants from Guyana (10.6%, a difference of 0.080%), Immigrants from Chile (10.6%, a difference of 0.14%), Sri Lankan (10.6%, a difference of 0.18%), and Immigrants from Ireland (10.6%, a difference of 0.18%).
| Demographics | Rating | Rank | Male Disability |
| Laotians | 98.6 /100 | #77 | Exceptional 10.6% |
| Immigrants | Russia | 98.6 /100 | #78 | Exceptional 10.6% |
| Zimbabweans | 98.4 /100 | #79 | Exceptional 10.6% |
| Immigrants | Jordan | 98.4 /100 | #80 | Exceptional 10.6% |
| Immigrants | Chile | 98.3 /100 | #81 | Exceptional 10.6% |
| Immigrants | Guyana | 98.2 /100 | #82 | Exceptional 10.6% |
| Immigrants | Poland | 98.1 /100 | #83 | Exceptional 10.6% |
| Bulgarians | 98.1 /100 | #84 | Exceptional 10.6% |
| Sri Lankans | 97.9 /100 | #85 | Exceptional 10.6% |
| Immigrants | Ireland | 97.9 /100 | #86 | Exceptional 10.6% |
| Immigrants | Vietnam | 97.9 /100 | #87 | Exceptional 10.6% |
| Immigrants | Western Asia | 97.8 /100 | #88 | Exceptional 10.6% |
| Immigrants | Nicaragua | 97.8 /100 | #89 | Exceptional 10.6% |
| Immigrants | Morocco | 97.7 /100 | #90 | Exceptional 10.6% |
| Immigrants | France | 97.6 /100 | #91 | Exceptional 10.6% |
Demographics Similar to Central American Indians by Male Disability
In terms of male disability, the demographic groups most similar to Central American Indians are Slovak (12.7%, a difference of 0.15%), Dutch (12.7%, a difference of 0.20%), Sioux (12.7%, a difference of 0.26%), Irish (12.7%, a difference of 0.31%), and German (12.7%, a difference of 0.32%).
| Demographics | Rating | Rank | Male Disability |
| Scandinavians | 0.1 /100 | #271 | Tragic 12.3% |
| Hmong | 0.0 /100 | #272 | Tragic 12.5% |
| Native Hawaiians | 0.0 /100 | #273 | Tragic 12.5% |
| Hopi | 0.0 /100 | #274 | Tragic 12.5% |
| Fijians | 0.0 /100 | #275 | Tragic 12.6% |
| Africans | 0.0 /100 | #276 | Tragic 12.6% |
| Finns | 0.0 /100 | #277 | Tragic 12.6% |
| Central American Indians | 0.0 /100 | #278 | Tragic 12.7% |
| Slovaks | 0.0 /100 | #279 | Tragic 12.7% |
| Dutch | 0.0 /100 | #280 | Tragic 12.7% |
| Sioux | 0.0 /100 | #281 | Tragic 12.7% |
| Irish | 0.0 /100 | #282 | Tragic 12.7% |
| Germans | 0.0 /100 | #283 | Tragic 12.7% |
| Spanish | 0.0 /100 | #284 | Tragic 12.7% |
| Welsh | 0.0 /100 | #285 | Tragic 12.7% |