Immigrants from Ethiopia vs Subsaharan African Single Male Poverty
COMPARE
Immigrants from Ethiopia
Subsaharan African
Single Male Poverty
Single Male Poverty Comparison
Immigrants from Ethiopia
Sub-Saharan Africans
11.4%
SINGLE MALE POVERTY
100.0/ 100
METRIC RATING
34th/ 347
METRIC RANK
13.7%
SINGLE MALE POVERTY
0.5/ 100
METRIC RATING
254th/ 347
METRIC RANK
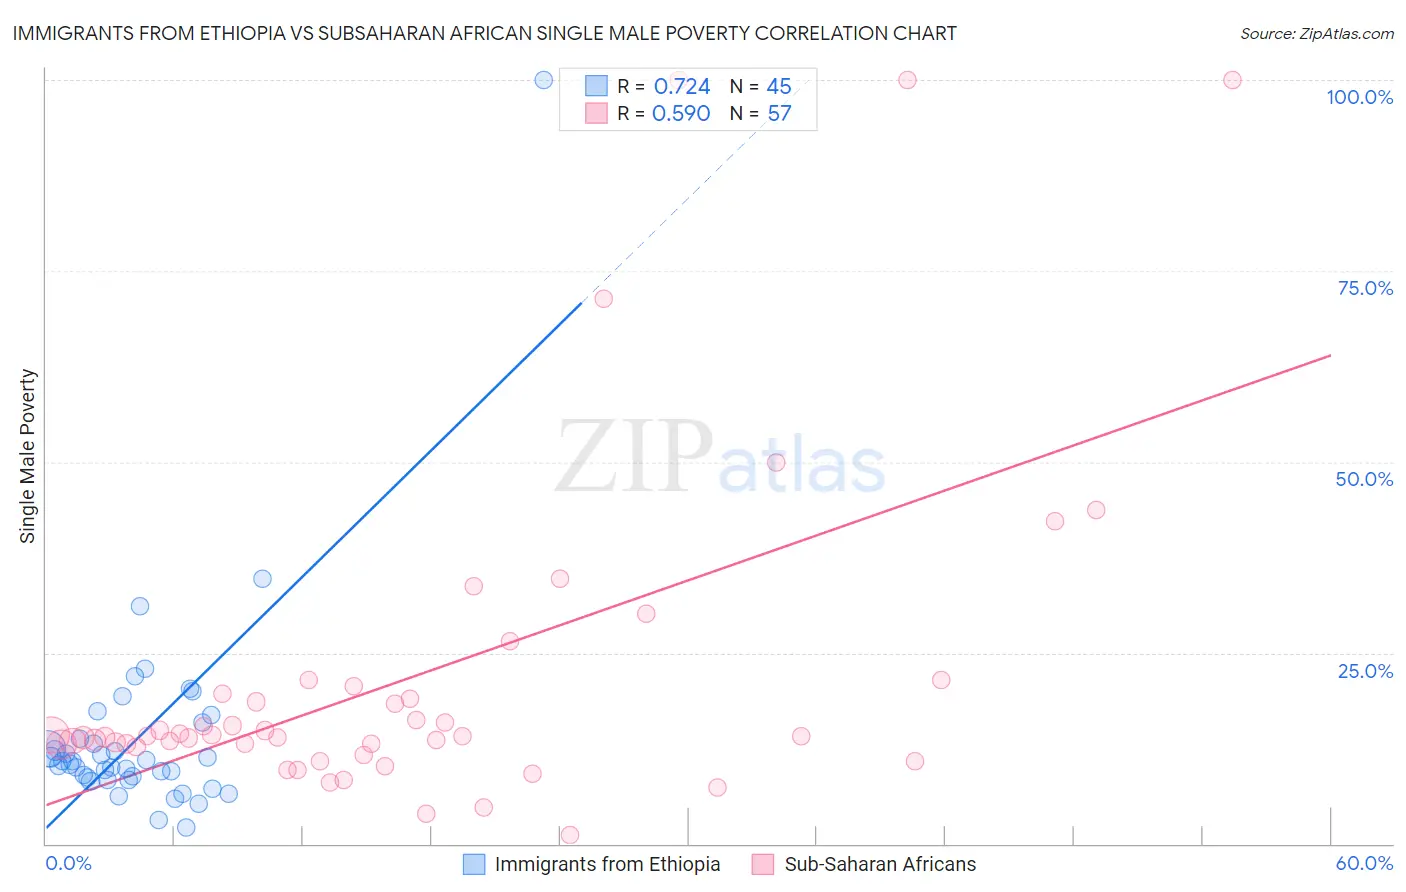
Immigrants from Ethiopia vs Subsaharan African Single Male Poverty Correlation Chart
The statistical analysis conducted on geographies consisting of 197,139,840 people shows a strong positive correlation between the proportion of Immigrants from Ethiopia and poverty level among single males in the United States with a correlation coefficient (R) of 0.724 and weighted average of 11.4%. Similarly, the statistical analysis conducted on geographies consisting of 440,120,617 people shows a substantial positive correlation between the proportion of Sub-Saharan Africans and poverty level among single males in the United States with a correlation coefficient (R) of 0.590 and weighted average of 13.7%, a difference of 19.8%.
Single Male Poverty Correlation Summary
| Measurement | Immigrants from Ethiopia | Subsaharan African |
| Minimum | 2.2% | 1.1% |
| Maximum | 100.0% | 100.0% |
| Range | 97.8% | 98.9% |
| Mean | 14.1% | 21.8% |
| Median | 10.8% | 14.1% |
| Interquartile 25% (IQ1) | 8.5% | 12.8% |
| Interquartile 75% (IQ3) | 14.8% | 20.1% |
| Interquartile Range (IQR) | 6.3% | 7.3% |
| Standard Deviation (Sample) | 14.6% | 22.0% |
| Standard Deviation (Population) | 14.4% | 21.8% |
Similar Demographics by Single Male Poverty
Demographics Similar to Immigrants from Ethiopia by Single Male Poverty
In terms of single male poverty, the demographic groups most similar to Immigrants from Ethiopia are Immigrants from Vietnam (11.4%, a difference of 0.040%), Immigrants from South Eastern Asia (11.4%, a difference of 0.040%), Immigrants from Serbia (11.4%, a difference of 0.070%), Immigrants from Eastern Asia (11.4%, a difference of 0.11%), and Immigrants from Singapore (11.4%, a difference of 0.12%).
| Demographics | Rating | Rank | Single Male Poverty |
| Immigrants | China | 100.0 /100 | #27 | Exceptional 11.4% |
| Immigrants | Asia | 100.0 /100 | #28 | Exceptional 11.4% |
| Immigrants | Egypt | 100.0 /100 | #29 | Exceptional 11.4% |
| Iranians | 100.0 /100 | #30 | Exceptional 11.4% |
| Immigrants | Iran | 100.0 /100 | #31 | Exceptional 11.4% |
| Immigrants | Eastern Asia | 100.0 /100 | #32 | Exceptional 11.4% |
| Immigrants | Vietnam | 100.0 /100 | #33 | Exceptional 11.4% |
| Immigrants | Ethiopia | 100.0 /100 | #34 | Exceptional 11.4% |
| Immigrants | South Eastern Asia | 100.0 /100 | #35 | Exceptional 11.4% |
| Immigrants | Serbia | 100.0 /100 | #36 | Exceptional 11.4% |
| Immigrants | Singapore | 100.0 /100 | #37 | Exceptional 11.4% |
| Sri Lankans | 100.0 /100 | #38 | Exceptional 11.5% |
| Soviet Union | 100.0 /100 | #39 | Exceptional 11.5% |
| Immigrants | Korea | 100.0 /100 | #40 | Exceptional 11.5% |
| Immigrants | Iraq | 99.9 /100 | #41 | Exceptional 11.5% |
Demographics Similar to Sub-Saharan Africans by Single Male Poverty
In terms of single male poverty, the demographic groups most similar to Sub-Saharan Africans are Spaniard (13.7%, a difference of 0.11%), Immigrants from Belize (13.7%, a difference of 0.21%), Immigrants from Central America (13.8%, a difference of 0.40%), Immigrants from Guatemala (13.8%, a difference of 0.47%), and Guatemalan (13.8%, a difference of 0.51%).
| Demographics | Rating | Rank | Single Male Poverty |
| Belgians | 1.2 /100 | #247 | Tragic 13.5% |
| Czechs | 1.2 /100 | #248 | Tragic 13.5% |
| Spanish | 1.0 /100 | #249 | Tragic 13.6% |
| Immigrants | Somalia | 1.0 /100 | #250 | Tragic 13.6% |
| Immigrants | Zaire | 0.9 /100 | #251 | Tragic 13.6% |
| Finns | 0.9 /100 | #252 | Tragic 13.6% |
| German Russians | 0.8 /100 | #253 | Tragic 13.6% |
| Sub-Saharan Africans | 0.5 /100 | #254 | Tragic 13.7% |
| Spaniards | 0.4 /100 | #255 | Tragic 13.7% |
| Immigrants | Belize | 0.4 /100 | #256 | Tragic 13.7% |
| Immigrants | Central America | 0.3 /100 | #257 | Tragic 13.8% |
| Immigrants | Guatemala | 0.3 /100 | #258 | Tragic 13.8% |
| Guatemalans | 0.3 /100 | #259 | Tragic 13.8% |
| Swiss | 0.3 /100 | #260 | Tragic 13.8% |
| Hungarians | 0.3 /100 | #261 | Tragic 13.8% |