Immigrants from Ethiopia vs Immigrants from Bahamas Self-Care Disability
COMPARE
Immigrants from Ethiopia
Immigrants from Bahamas
Self-Care Disability
Self-Care Disability Comparison
Immigrants from Ethiopia
Immigrants from Bahamas
2.2%
SELF-CARE DISABILITY
100.0/ 100
METRIC RATING
12th/ 347
METRIC RANK
2.5%
SELF-CARE DISABILITY
11.9/ 100
METRIC RATING
204th/ 347
METRIC RANK
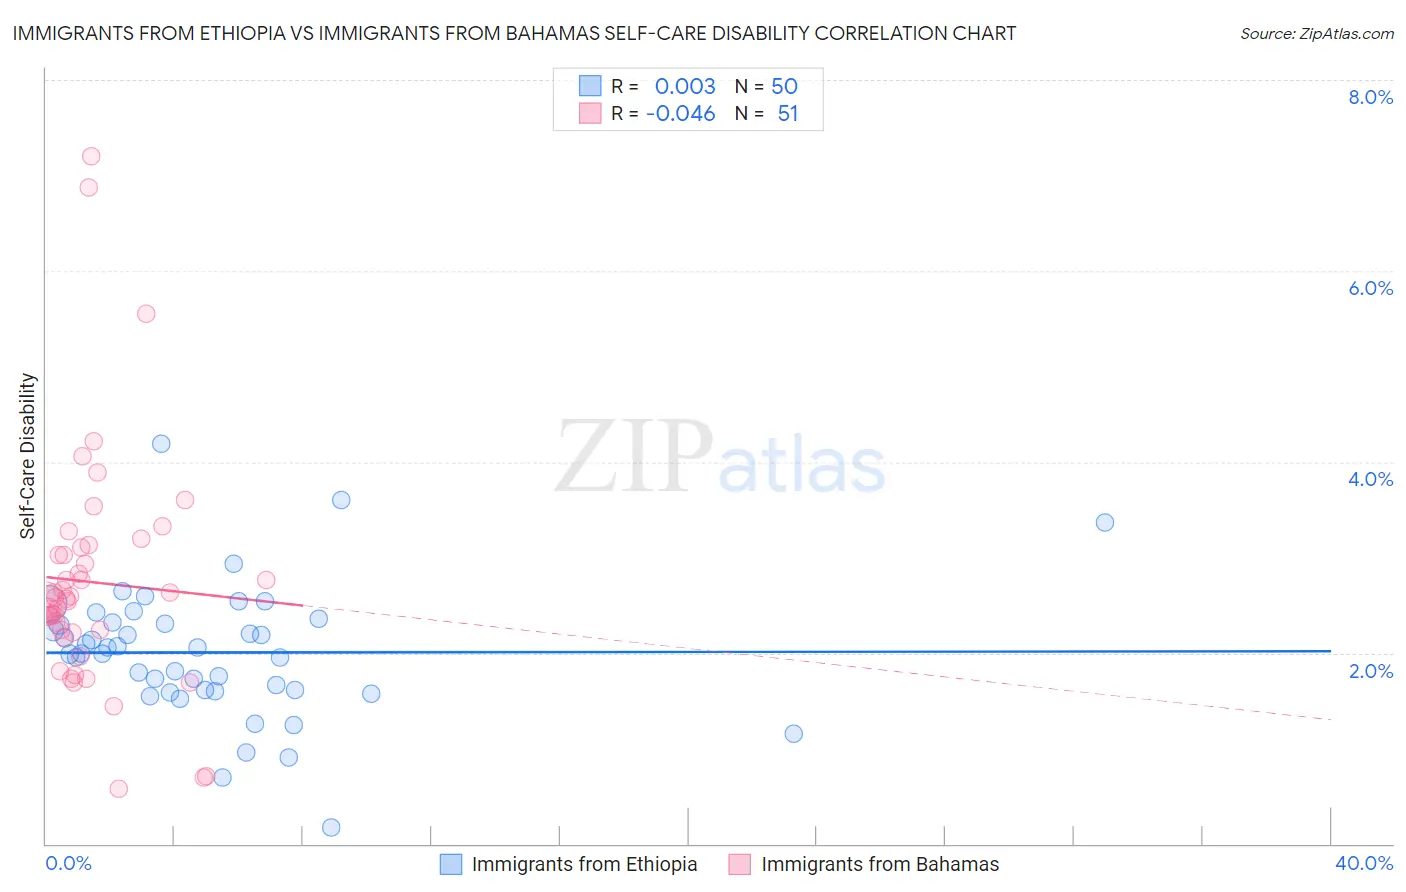
Immigrants from Ethiopia vs Immigrants from Bahamas Self-Care Disability Correlation Chart
The statistical analysis conducted on geographies consisting of 211,457,724 people shows no correlation between the proportion of Immigrants from Ethiopia and percentage of population with self-care disability in the United States with a correlation coefficient (R) of 0.003 and weighted average of 2.2%. Similarly, the statistical analysis conducted on geographies consisting of 104,603,388 people shows no correlation between the proportion of Immigrants from Bahamas and percentage of population with self-care disability in the United States with a correlation coefficient (R) of -0.046 and weighted average of 2.5%, a difference of 15.1%.
Self-Care Disability Correlation Summary
| Measurement | Immigrants from Ethiopia | Immigrants from Bahamas |
| Minimum | 0.17% | 0.58% |
| Maximum | 4.2% | 7.2% |
| Range | 4.0% | 6.6% |
| Mean | 2.0% | 2.7% |
| Median | 2.0% | 2.6% |
| Interquartile 25% (IQ1) | 1.6% | 2.2% |
| Interquartile 75% (IQ3) | 2.3% | 3.1% |
| Interquartile Range (IQR) | 0.71% | 0.89% |
| Standard Deviation (Sample) | 0.69% | 1.2% |
| Standard Deviation (Population) | 0.69% | 1.2% |
Similar Demographics by Self-Care Disability
Demographics Similar to Immigrants from Ethiopia by Self-Care Disability
In terms of self-care disability, the demographic groups most similar to Immigrants from Ethiopia are Ethiopian (2.2%, a difference of 0.010%), Immigrants from South Central Asia (2.2%, a difference of 0.050%), Sudanese (2.2%, a difference of 0.16%), Luxembourger (2.2%, a difference of 0.17%), and Okinawan (2.2%, a difference of 0.18%).
| Demographics | Rating | Rank | Self-Care Disability |
| Zimbabweans | 100.0 /100 | #5 | Exceptional 2.2% |
| Filipinos | 100.0 /100 | #6 | Exceptional 2.2% |
| Immigrants | Bolivia | 100.0 /100 | #7 | Exceptional 2.2% |
| Bolivians | 100.0 /100 | #8 | Exceptional 2.2% |
| Immigrants | Nepal | 100.0 /100 | #9 | Exceptional 2.2% |
| Sudanese | 100.0 /100 | #10 | Exceptional 2.2% |
| Immigrants | South Central Asia | 100.0 /100 | #11 | Exceptional 2.2% |
| Immigrants | Ethiopia | 100.0 /100 | #12 | Exceptional 2.2% |
| Ethiopians | 100.0 /100 | #13 | Exceptional 2.2% |
| Luxembourgers | 100.0 /100 | #14 | Exceptional 2.2% |
| Okinawans | 100.0 /100 | #15 | Exceptional 2.2% |
| Immigrants | Kuwait | 100.0 /100 | #16 | Exceptional 2.2% |
| Immigrants | Saudi Arabia | 100.0 /100 | #17 | Exceptional 2.2% |
| Immigrants | Taiwan | 100.0 /100 | #18 | Exceptional 2.2% |
| Immigrants | Eritrea | 100.0 /100 | #19 | Exceptional 2.2% |
Demographics Similar to Immigrants from Bahamas by Self-Care Disability
In terms of self-care disability, the demographic groups most similar to Immigrants from Bahamas are Immigrants from Lebanon (2.5%, a difference of 0.050%), Slovak (2.5%, a difference of 0.080%), Immigrants from Russia (2.5%, a difference of 0.10%), Immigrants from South Eastern Asia (2.5%, a difference of 0.11%), and Immigrants from Western Africa (2.5%, a difference of 0.14%).
| Demographics | Rating | Rank | Self-Care Disability |
| Crow | 15.2 /100 | #197 | Poor 2.5% |
| Immigrants | Immigrants | 15.0 /100 | #198 | Poor 2.5% |
| Immigrants | Ghana | 14.7 /100 | #199 | Poor 2.5% |
| Immigrants | Western Africa | 13.3 /100 | #200 | Poor 2.5% |
| Immigrants | South Eastern Asia | 12.9 /100 | #201 | Poor 2.5% |
| Slovaks | 12.6 /100 | #202 | Poor 2.5% |
| Immigrants | Lebanon | 12.4 /100 | #203 | Poor 2.5% |
| Immigrants | Bahamas | 11.9 /100 | #204 | Poor 2.5% |
| Immigrants | Russia | 11.0 /100 | #205 | Poor 2.5% |
| Alaskan Athabascans | 10.4 /100 | #206 | Poor 2.5% |
| French | 9.9 /100 | #207 | Tragic 2.5% |
| Central Americans | 8.7 /100 | #208 | Tragic 2.5% |
| Malaysians | 7.7 /100 | #209 | Tragic 2.5% |
| Panamanians | 6.4 /100 | #210 | Tragic 2.5% |
| Native Hawaiians | 5.1 /100 | #211 | Tragic 2.6% |