Immigrants from Ethiopia vs Immigrants from Bahamas Births to Unmarried Women
COMPARE
Immigrants from Ethiopia
Immigrants from Bahamas
Births to Unmarried Women
Births to Unmarried Women Comparison
Immigrants from Ethiopia
Immigrants from Bahamas
29.7%
BIRTHS TO UNMARRIED WOMEN
93.4/ 100
METRIC RATING
110th/ 347
METRIC RANK
40.1%
BIRTHS TO UNMARRIED WOMEN
0.0/ 100
METRIC RATING
318th/ 347
METRIC RANK
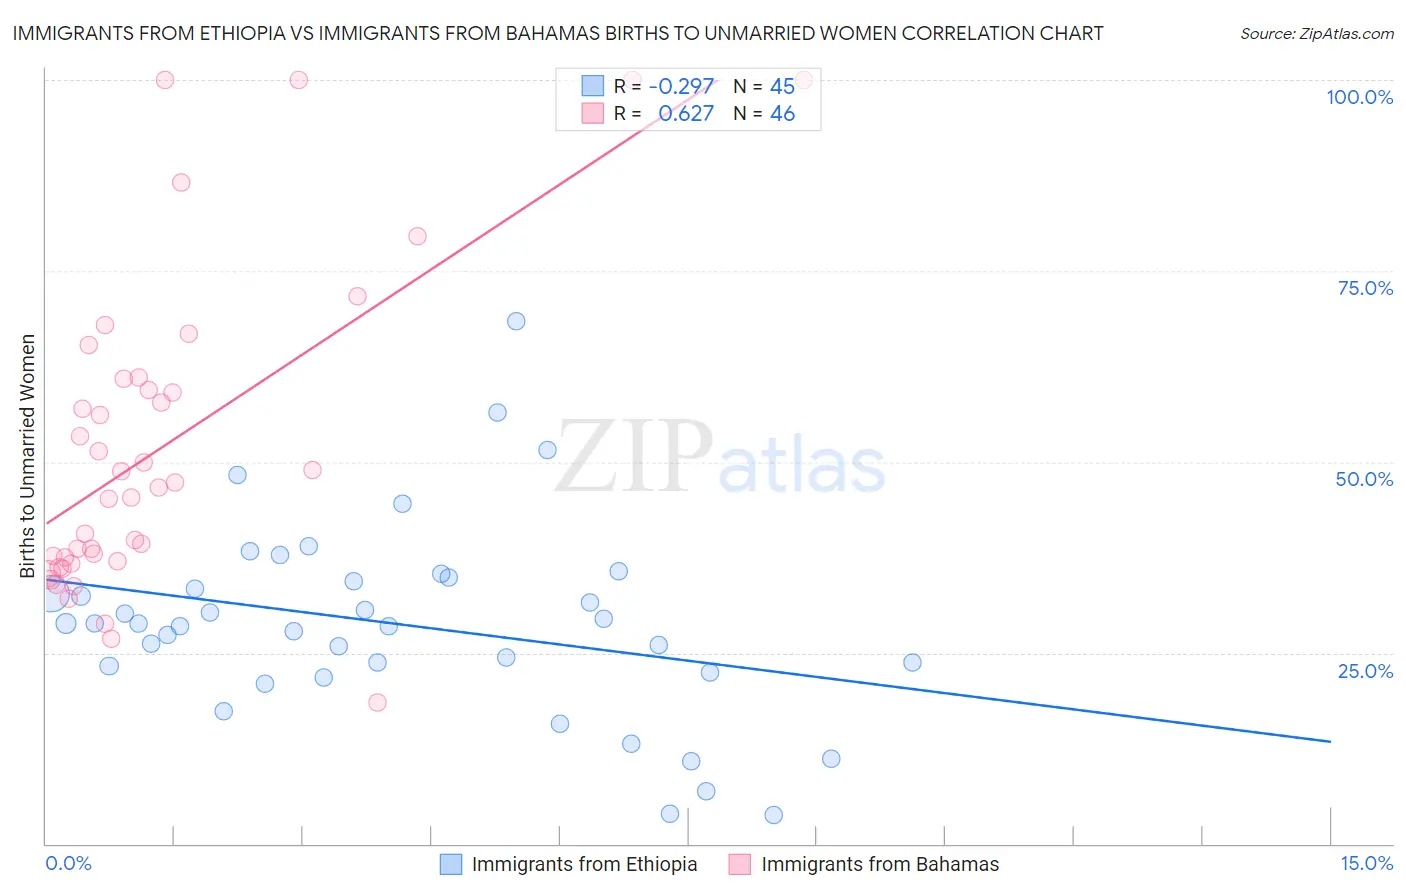
Immigrants from Ethiopia vs Immigrants from Bahamas Births to Unmarried Women Correlation Chart
The statistical analysis conducted on geographies consisting of 204,461,037 people shows a weak negative correlation between the proportion of Immigrants from Ethiopia and percentage of births to unmarried women in the United States with a correlation coefficient (R) of -0.297 and weighted average of 29.7%. Similarly, the statistical analysis conducted on geographies consisting of 103,055,032 people shows a significant positive correlation between the proportion of Immigrants from Bahamas and percentage of births to unmarried women in the United States with a correlation coefficient (R) of 0.627 and weighted average of 40.1%, a difference of 35.1%.
Births to Unmarried Women Correlation Summary
| Measurement | Immigrants from Ethiopia | Immigrants from Bahamas |
| Minimum | 3.7% | 18.5% |
| Maximum | 68.3% | 100.0% |
| Range | 64.6% | 81.5% |
| Mean | 28.8% | 51.9% |
| Median | 28.8% | 47.0% |
| Interquartile 25% (IQ1) | 22.8% | 37.0% |
| Interquartile 75% (IQ3) | 34.7% | 60.9% |
| Interquartile Range (IQR) | 11.8% | 23.9% |
| Standard Deviation (Sample) | 12.8% | 20.6% |
| Standard Deviation (Population) | 12.6% | 20.3% |
Similar Demographics by Births to Unmarried Women
Demographics Similar to Immigrants from Ethiopia by Births to Unmarried Women
In terms of births to unmarried women, the demographic groups most similar to Immigrants from Ethiopia are Greek (29.7%, a difference of 0.030%), Paraguayan (29.7%, a difference of 0.070%), Immigrants from Hungary (29.7%, a difference of 0.14%), Immigrants from Brazil (29.6%, a difference of 0.15%), and Basque (29.7%, a difference of 0.15%).
| Demographics | Rating | Rank | Births to Unmarried Women |
| Lebanese | 94.4 /100 | #103 | Exceptional 29.5% |
| Lithuanians | 94.4 /100 | #104 | Exceptional 29.6% |
| Immigrants | Nepal | 94.3 /100 | #105 | Exceptional 29.6% |
| Swedes | 93.8 /100 | #106 | Exceptional 29.6% |
| Immigrants | Brazil | 93.7 /100 | #107 | Exceptional 29.6% |
| Paraguayans | 93.5 /100 | #108 | Exceptional 29.7% |
| Greeks | 93.4 /100 | #109 | Exceptional 29.7% |
| Immigrants | Ethiopia | 93.4 /100 | #110 | Exceptional 29.7% |
| Immigrants | Hungary | 93.0 /100 | #111 | Exceptional 29.7% |
| Basques | 93.0 /100 | #112 | Exceptional 29.7% |
| Scandinavians | 92.7 /100 | #113 | Exceptional 29.8% |
| Immigrants | Croatia | 92.6 /100 | #114 | Exceptional 29.8% |
| Ethiopians | 91.9 /100 | #115 | Exceptional 29.8% |
| Immigrants | Italy | 91.7 /100 | #116 | Exceptional 29.9% |
| Immigrants | Netherlands | 91.1 /100 | #117 | Exceptional 29.9% |
Demographics Similar to Immigrants from Bahamas by Births to Unmarried Women
In terms of births to unmarried women, the demographic groups most similar to Immigrants from Bahamas are Immigrants from Dominican Republic (40.1%, a difference of 0.070%), Yakama (40.3%, a difference of 0.56%), Crow (40.4%, a difference of 0.61%), Apache (39.9%, a difference of 0.62%), and Dominican (39.8%, a difference of 0.68%).
| Demographics | Rating | Rank | Births to Unmarried Women |
| Immigrants | Azores | 0.0 /100 | #311 | Tragic 39.6% |
| U.S. Virgin Islanders | 0.0 /100 | #312 | Tragic 39.6% |
| Africans | 0.0 /100 | #313 | Tragic 39.7% |
| Immigrants | Caribbean | 0.0 /100 | #314 | Tragic 39.8% |
| Dominicans | 0.0 /100 | #315 | Tragic 39.8% |
| Apache | 0.0 /100 | #316 | Tragic 39.9% |
| Immigrants | Dominican Republic | 0.0 /100 | #317 | Tragic 40.1% |
| Immigrants | Bahamas | 0.0 /100 | #318 | Tragic 40.1% |
| Yakama | 0.0 /100 | #319 | Tragic 40.3% |
| Crow | 0.0 /100 | #320 | Tragic 40.4% |
| Bahamians | 0.0 /100 | #321 | Tragic 40.8% |
| Cajuns | 0.0 /100 | #322 | Tragic 41.0% |
| Sioux | 0.0 /100 | #323 | Tragic 41.0% |
| Cape Verdeans | 0.0 /100 | #324 | Tragic 41.3% |
| Cheyenne | 0.0 /100 | #325 | Tragic 41.3% |