Guatemalan vs Immigrants from Turkey Male Disability
COMPARE
Guatemalan
Immigrants from Turkey
Male Disability
Male Disability Comparison
Guatemalans
Immigrants from Turkey
11.1%
MALE DISABILITY
67.2/ 100
METRIC RATING
159th/ 347
METRIC RANK
10.2%
MALE DISABILITY
99.9/ 100
METRIC RATING
34th/ 347
METRIC RANK
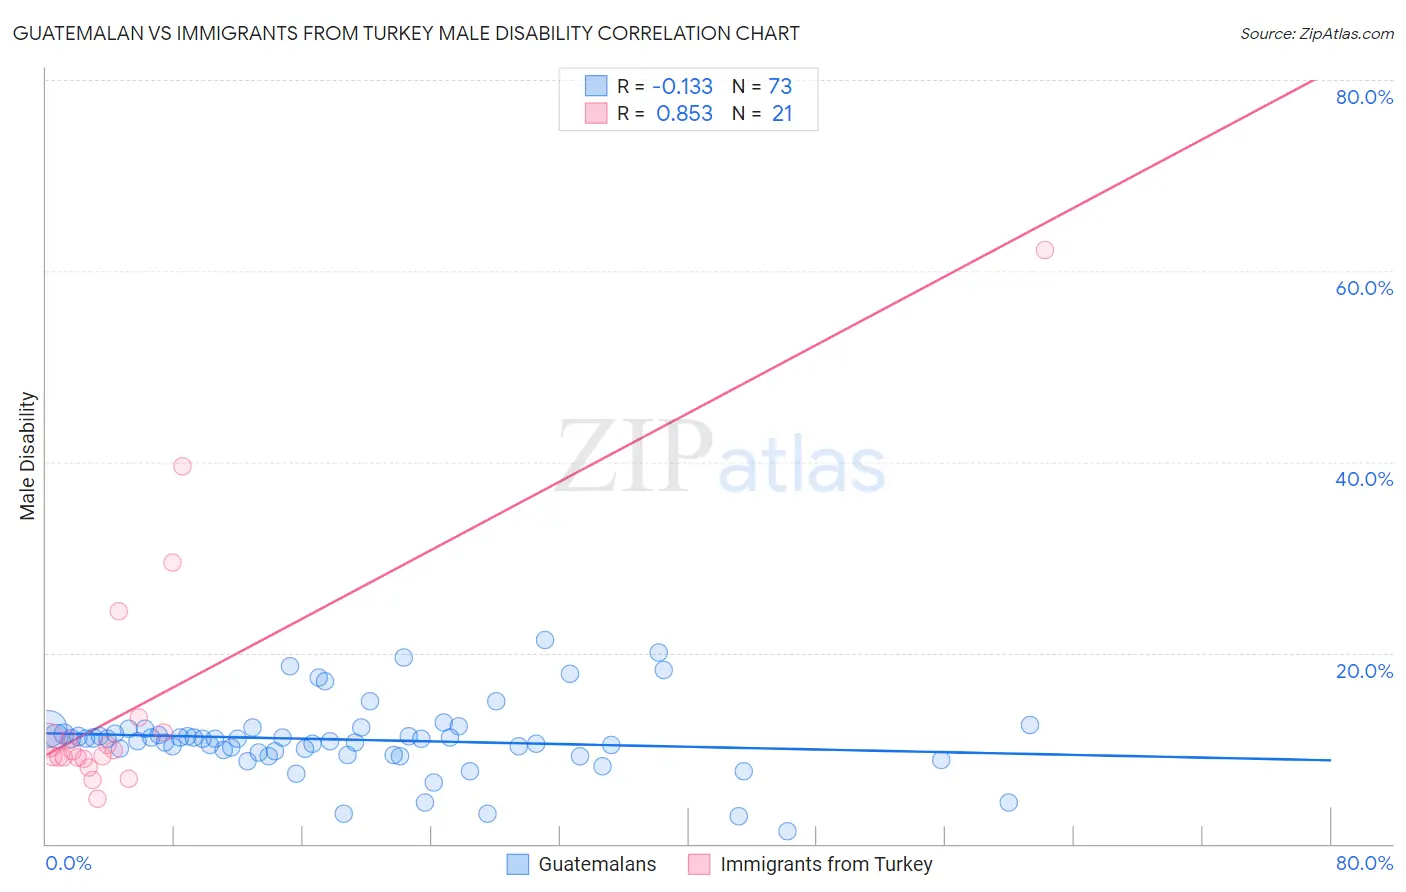
Guatemalan vs Immigrants from Turkey Male Disability Correlation Chart
The statistical analysis conducted on geographies consisting of 409,466,260 people shows a poor negative correlation between the proportion of Guatemalans and percentage of males with a disability in the United States with a correlation coefficient (R) of -0.133 and weighted average of 11.1%. Similarly, the statistical analysis conducted on geographies consisting of 223,048,853 people shows a very strong positive correlation between the proportion of Immigrants from Turkey and percentage of males with a disability in the United States with a correlation coefficient (R) of 0.853 and weighted average of 10.2%, a difference of 9.0%.
Male Disability Correlation Summary
| Measurement | Guatemalan | Immigrants from Turkey |
| Minimum | 1.3% | 4.8% |
| Maximum | 21.3% | 62.2% |
| Range | 20.1% | 57.4% |
| Mean | 10.9% | 14.9% |
| Median | 11.0% | 9.7% |
| Interquartile 25% (IQ1) | 9.5% | 9.0% |
| Interquartile 75% (IQ3) | 11.8% | 12.5% |
| Interquartile Range (IQR) | 2.3% | 3.5% |
| Standard Deviation (Sample) | 3.8% | 13.7% |
| Standard Deviation (Population) | 3.7% | 13.4% |
Similar Demographics by Male Disability
Demographics Similar to Guatemalans by Male Disability
In terms of male disability, the demographic groups most similar to Guatemalans are Albanian (11.1%, a difference of 0.040%), Latvian (11.1%, a difference of 0.060%), Immigrants from West Indies (11.1%, a difference of 0.090%), Immigrants from Haiti (11.1%, a difference of 0.12%), and Immigrants from Western Africa (11.1%, a difference of 0.13%).
| Demographics | Rating | Rank | Male Disability |
| Immigrants | Albania | 74.4 /100 | #152 | Good 11.0% |
| Immigrants | Northern Europe | 73.2 /100 | #153 | Good 11.1% |
| Immigrants | Moldova | 72.8 /100 | #154 | Good 11.1% |
| Immigrants | Middle Africa | 70.9 /100 | #155 | Good 11.1% |
| Russians | 69.8 /100 | #156 | Good 11.1% |
| Immigrants | Western Africa | 69.2 /100 | #157 | Good 11.1% |
| Latvians | 68.1 /100 | #158 | Good 11.1% |
| Guatemalans | 67.2 /100 | #159 | Good 11.1% |
| Albanians | 66.5 /100 | #160 | Good 11.1% |
| Immigrants | West Indies | 65.7 /100 | #161 | Good 11.1% |
| Immigrants | Haiti | 65.3 /100 | #162 | Good 11.1% |
| Immigrants | Kenya | 63.8 /100 | #163 | Good 11.1% |
| British West Indians | 62.8 /100 | #164 | Good 11.1% |
| Luxembourgers | 61.9 /100 | #165 | Good 11.1% |
| Immigrants | Hungary | 61.2 /100 | #166 | Good 11.1% |
Demographics Similar to Immigrants from Turkey by Male Disability
In terms of male disability, the demographic groups most similar to Immigrants from Turkey are Immigrants from Ethiopia (10.2%, a difference of 0.060%), Immigrants from Argentina (10.2%, a difference of 0.11%), Ethiopian (10.2%, a difference of 0.16%), Immigrants from Indonesia (10.2%, a difference of 0.24%), and Immigrants from Kuwait (10.2%, a difference of 0.41%).
| Demographics | Rating | Rank | Male Disability |
| Egyptians | 99.9 /100 | #27 | Exceptional 10.1% |
| Vietnamese | 99.9 /100 | #28 | Exceptional 10.1% |
| Venezuelans | 99.9 /100 | #29 | Exceptional 10.1% |
| Immigrants | Egypt | 99.9 /100 | #30 | Exceptional 10.1% |
| Soviet Union | 99.9 /100 | #31 | Exceptional 10.1% |
| Argentineans | 99.9 /100 | #32 | Exceptional 10.1% |
| Immigrants | Ethiopia | 99.9 /100 | #33 | Exceptional 10.2% |
| Immigrants | Turkey | 99.9 /100 | #34 | Exceptional 10.2% |
| Immigrants | Argentina | 99.9 /100 | #35 | Exceptional 10.2% |
| Ethiopians | 99.8 /100 | #36 | Exceptional 10.2% |
| Immigrants | Indonesia | 99.8 /100 | #37 | Exceptional 10.2% |
| Immigrants | Kuwait | 99.8 /100 | #38 | Exceptional 10.2% |
| Afghans | 99.8 /100 | #39 | Exceptional 10.2% |
| Immigrants | Nepal | 99.8 /100 | #40 | Exceptional 10.3% |
| Taiwanese | 99.8 /100 | #41 | Exceptional 10.3% |