Immigrants from El Salvador vs Immigrants from Turkey Median Earnings
COMPARE
Immigrants from El Salvador
Immigrants from Turkey
Median Earnings
Median Earnings Comparison
Immigrants from El Salvador
Immigrants from Turkey
$42,413
MEDIAN EARNINGS
0.4/ 100
METRIC RATING
274th/ 347
METRIC RANK
$52,960
MEDIAN EARNINGS
100.0/ 100
METRIC RATING
39th/ 347
METRIC RANK
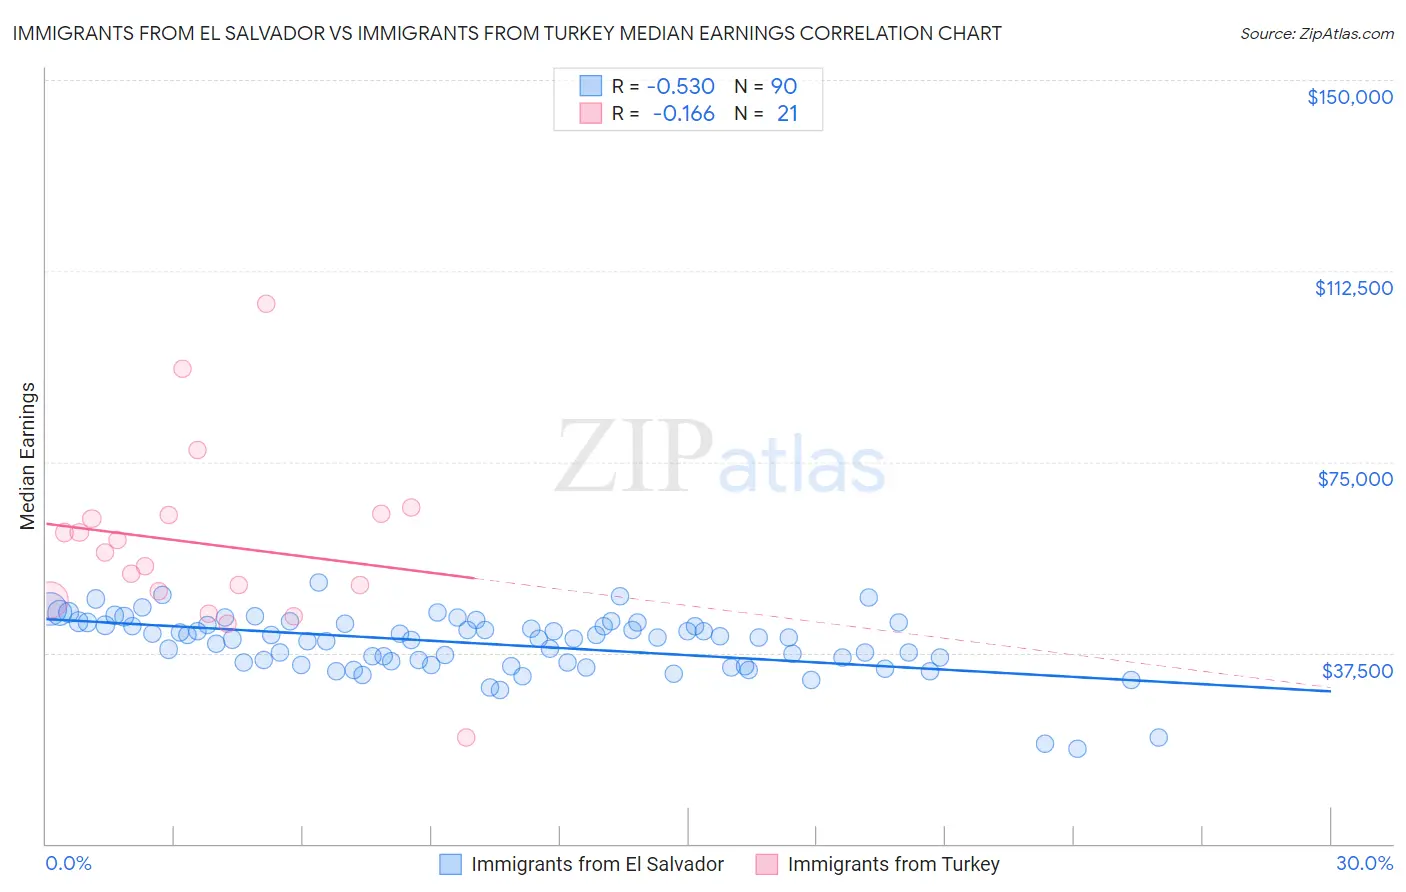
Immigrants from El Salvador vs Immigrants from Turkey Median Earnings Correlation Chart
The statistical analysis conducted on geographies consisting of 357,819,610 people shows a substantial negative correlation between the proportion of Immigrants from El Salvador and median earnings in the United States with a correlation coefficient (R) of -0.530 and weighted average of $42,413. Similarly, the statistical analysis conducted on geographies consisting of 223,042,474 people shows a poor negative correlation between the proportion of Immigrants from Turkey and median earnings in the United States with a correlation coefficient (R) of -0.166 and weighted average of $52,960, a difference of 24.9%.
Median Earnings Correlation Summary
| Measurement | Immigrants from El Salvador | Immigrants from Turkey |
| Minimum | $18,605 | $20,750 |
| Maximum | $51,289 | $106,061 |
| Range | $32,684 | $85,311 |
| Mean | $39,285 | $58,831 |
| Median | $40,413 | $57,227 |
| Interquartile 25% (IQ1) | $35,635 | $48,717 |
| Interquartile 75% (IQ3) | $43,130 | $64,687 |
| Interquartile Range (IQR) | $7,494 | $15,970 |
| Standard Deviation (Sample) | $5,807 | $17,879 |
| Standard Deviation (Population) | $5,775 | $17,448 |
Similar Demographics by Median Earnings
Demographics Similar to Immigrants from El Salvador by Median Earnings
In terms of median earnings, the demographic groups most similar to Immigrants from El Salvador are Immigrants from Dominica ($42,420, a difference of 0.020%), Iroquois ($42,430, a difference of 0.040%), Immigrants from Belize ($42,339, a difference of 0.18%), Spanish American ($42,316, a difference of 0.23%), and Central American ($42,280, a difference of 0.32%).
| Demographics | Rating | Rank | Median Earnings |
| Cree | 0.6 /100 | #267 | Tragic $42,777 |
| Americans | 0.6 /100 | #268 | Tragic $42,742 |
| Belizeans | 0.5 /100 | #269 | Tragic $42,702 |
| Osage | 0.5 /100 | #270 | Tragic $42,651 |
| Pennsylvania Germans | 0.5 /100 | #271 | Tragic $42,615 |
| Iroquois | 0.4 /100 | #272 | Tragic $42,430 |
| Immigrants | Dominica | 0.4 /100 | #273 | Tragic $42,420 |
| Immigrants | El Salvador | 0.4 /100 | #274 | Tragic $42,413 |
| Immigrants | Belize | 0.3 /100 | #275 | Tragic $42,339 |
| Spanish Americans | 0.3 /100 | #276 | Tragic $42,316 |
| Central Americans | 0.3 /100 | #277 | Tragic $42,280 |
| Cajuns | 0.3 /100 | #278 | Tragic $42,189 |
| Colville | 0.2 /100 | #279 | Tragic $42,151 |
| Hmong | 0.2 /100 | #280 | Tragic $42,111 |
| Marshallese | 0.2 /100 | #281 | Tragic $41,969 |
Demographics Similar to Immigrants from Turkey by Median Earnings
In terms of median earnings, the demographic groups most similar to Immigrants from Turkey are Israeli ($52,937, a difference of 0.040%), Latvian ($53,001, a difference of 0.080%), Immigrants from Belarus ($53,043, a difference of 0.16%), Immigrants from Lithuania ($52,769, a difference of 0.36%), and Immigrants from Denmark ($53,186, a difference of 0.43%).
| Demographics | Rating | Rank | Median Earnings |
| Immigrants | Asia | 100.0 /100 | #32 | Exceptional $53,310 |
| Immigrants | Greece | 100.0 /100 | #33 | Exceptional $53,282 |
| Immigrants | Sri Lanka | 100.0 /100 | #34 | Exceptional $53,268 |
| Immigrants | Switzerland | 100.0 /100 | #35 | Exceptional $53,211 |
| Immigrants | Denmark | 100.0 /100 | #36 | Exceptional $53,186 |
| Immigrants | Belarus | 100.0 /100 | #37 | Exceptional $53,043 |
| Latvians | 100.0 /100 | #38 | Exceptional $53,001 |
| Immigrants | Turkey | 100.0 /100 | #39 | Exceptional $52,960 |
| Israelis | 100.0 /100 | #40 | Exceptional $52,937 |
| Immigrants | Lithuania | 100.0 /100 | #41 | Exceptional $52,769 |
| Maltese | 100.0 /100 | #42 | Exceptional $52,526 |
| Immigrants | Malaysia | 100.0 /100 | #43 | Exceptional $52,514 |
| Bulgarians | 100.0 /100 | #44 | Exceptional $52,512 |
| Immigrants | Czechoslovakia | 100.0 /100 | #45 | Exceptional $52,361 |
| Bhutanese | 100.0 /100 | #46 | Exceptional $52,297 |