Immigrants from El Salvador vs Immigrants from Turkey Female Poverty Among 25-34 Year Olds
COMPARE
Immigrants from El Salvador
Immigrants from Turkey
Female Poverty Among 25-34 Year Olds
Female Poverty Among 25-34 Year Olds Comparison
Immigrants from El Salvador
Immigrants from Turkey
15.0%
FEMALE POVERTY AMONG 25-34 YEAR OLDS
0.5/ 100
METRIC RATING
250th/ 347
METRIC RANK
11.9%
FEMALE POVERTY AMONG 25-34 YEAR OLDS
99.7/ 100
METRIC RATING
42nd/ 347
METRIC RANK
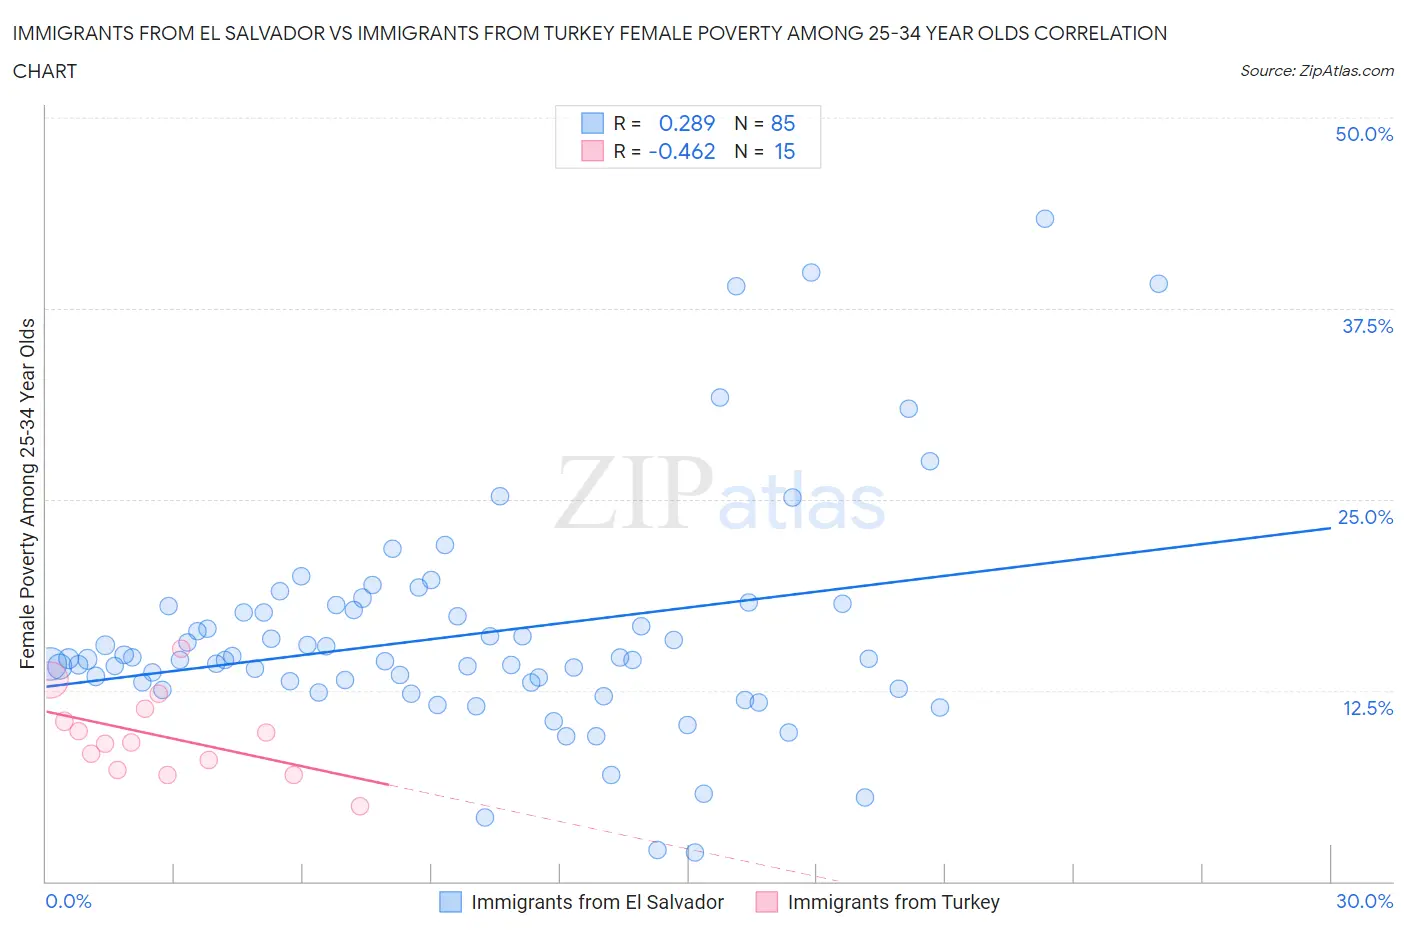
Immigrants from El Salvador vs Immigrants from Turkey Female Poverty Among 25-34 Year Olds Correlation Chart
The statistical analysis conducted on geographies consisting of 354,113,750 people shows a weak positive correlation between the proportion of Immigrants from El Salvador and poverty level among females between the ages 25 and 34 in the United States with a correlation coefficient (R) of 0.289 and weighted average of 15.0%. Similarly, the statistical analysis conducted on geographies consisting of 220,548,075 people shows a moderate negative correlation between the proportion of Immigrants from Turkey and poverty level among females between the ages 25 and 34 in the United States with a correlation coefficient (R) of -0.462 and weighted average of 11.9%, a difference of 26.3%.
Female Poverty Among 25-34 Year Olds Correlation Summary
| Measurement | Immigrants from El Salvador | Immigrants from Turkey |
| Minimum | 1.9% | 4.9% |
| Maximum | 43.4% | 15.3% |
| Range | 41.5% | 10.3% |
| Mean | 16.1% | 9.5% |
| Median | 14.5% | 9.1% |
| Interquartile 25% (IQ1) | 12.8% | 7.3% |
| Interquartile 75% (IQ3) | 17.9% | 11.3% |
| Interquartile Range (IQR) | 5.1% | 4.0% |
| Standard Deviation (Sample) | 7.4% | 2.7% |
| Standard Deviation (Population) | 7.4% | 2.6% |
Similar Demographics by Female Poverty Among 25-34 Year Olds
Demographics Similar to Immigrants from El Salvador by Female Poverty Among 25-34 Year Olds
In terms of female poverty among 25-34 year olds, the demographic groups most similar to Immigrants from El Salvador are Immigrants from Haiti (15.0%, a difference of 0.030%), Haitian (15.0%, a difference of 0.19%), Belizean (15.1%, a difference of 0.36%), Immigrants from West Indies (15.1%, a difference of 0.50%), and Somali (15.1%, a difference of 0.58%).
| Demographics | Rating | Rank | Female Poverty Among 25-34 Year Olds |
| Immigrants | Nicaragua | 1.1 /100 | #243 | Tragic 14.8% |
| Immigrants | Bangladesh | 1.1 /100 | #244 | Tragic 14.8% |
| Immigrants | Middle Africa | 1.0 /100 | #245 | Tragic 14.8% |
| Jamaicans | 1.0 /100 | #246 | Tragic 14.8% |
| German Russians | 0.8 /100 | #247 | Tragic 14.9% |
| Immigrants | Western Africa | 0.8 /100 | #248 | Tragic 14.9% |
| Immigrants | Haiti | 0.5 /100 | #249 | Tragic 15.0% |
| Immigrants | El Salvador | 0.5 /100 | #250 | Tragic 15.0% |
| Haitians | 0.5 /100 | #251 | Tragic 15.0% |
| Belizeans | 0.4 /100 | #252 | Tragic 15.1% |
| Immigrants | West Indies | 0.4 /100 | #253 | Tragic 15.1% |
| Somalis | 0.4 /100 | #254 | Tragic 15.1% |
| Immigrants | Laos | 0.3 /100 | #255 | Tragic 15.2% |
| West Indians | 0.3 /100 | #256 | Tragic 15.2% |
| Immigrants | Burma/Myanmar | 0.3 /100 | #257 | Tragic 15.2% |
Demographics Similar to Immigrants from Turkey by Female Poverty Among 25-34 Year Olds
In terms of female poverty among 25-34 year olds, the demographic groups most similar to Immigrants from Turkey are Egyptian (11.9%, a difference of 0.25%), Immigrants from Australia (11.9%, a difference of 0.26%), Immigrants from Indonesia (11.8%, a difference of 0.30%), Immigrants from Bulgaria (11.8%, a difference of 0.42%), and Macedonian (11.9%, a difference of 0.53%).
| Demographics | Rating | Rank | Female Poverty Among 25-34 Year Olds |
| Cambodians | 99.9 /100 | #35 | Exceptional 11.7% |
| Immigrants | Sri Lanka | 99.8 /100 | #36 | Exceptional 11.8% |
| Taiwanese | 99.8 /100 | #37 | Exceptional 11.8% |
| Immigrants | North Macedonia | 99.8 /100 | #38 | Exceptional 11.8% |
| Latvians | 99.8 /100 | #39 | Exceptional 11.8% |
| Immigrants | Bulgaria | 99.8 /100 | #40 | Exceptional 11.8% |
| Immigrants | Indonesia | 99.8 /100 | #41 | Exceptional 11.8% |
| Immigrants | Turkey | 99.7 /100 | #42 | Exceptional 11.9% |
| Egyptians | 99.7 /100 | #43 | Exceptional 11.9% |
| Immigrants | Australia | 99.7 /100 | #44 | Exceptional 11.9% |
| Macedonians | 99.7 /100 | #45 | Exceptional 11.9% |
| Immigrants | Serbia | 99.7 /100 | #46 | Exceptional 11.9% |
| Koreans | 99.6 /100 | #47 | Exceptional 12.0% |
| Immigrants | Belarus | 99.6 /100 | #48 | Exceptional 12.0% |
| Immigrants | Egypt | 99.6 /100 | #49 | Exceptional 12.0% |