Immigrants from El Salvador vs Immigrants from Belize Child Poverty Under the Age of 5
COMPARE
Immigrants from El Salvador
Immigrants from Belize
Child Poverty Under the Age of 5
Child Poverty Under the Age of 5 Comparison
Immigrants from El Salvador
Immigrants from Belize
20.0%
CHILD POVERTY UNDER THE AGE OF 5
0.2/ 100
METRIC RATING
259th/ 347
METRIC RANK
20.6%
CHILD POVERTY UNDER THE AGE OF 5
0.1/ 100
METRIC RATING
274th/ 347
METRIC RANK
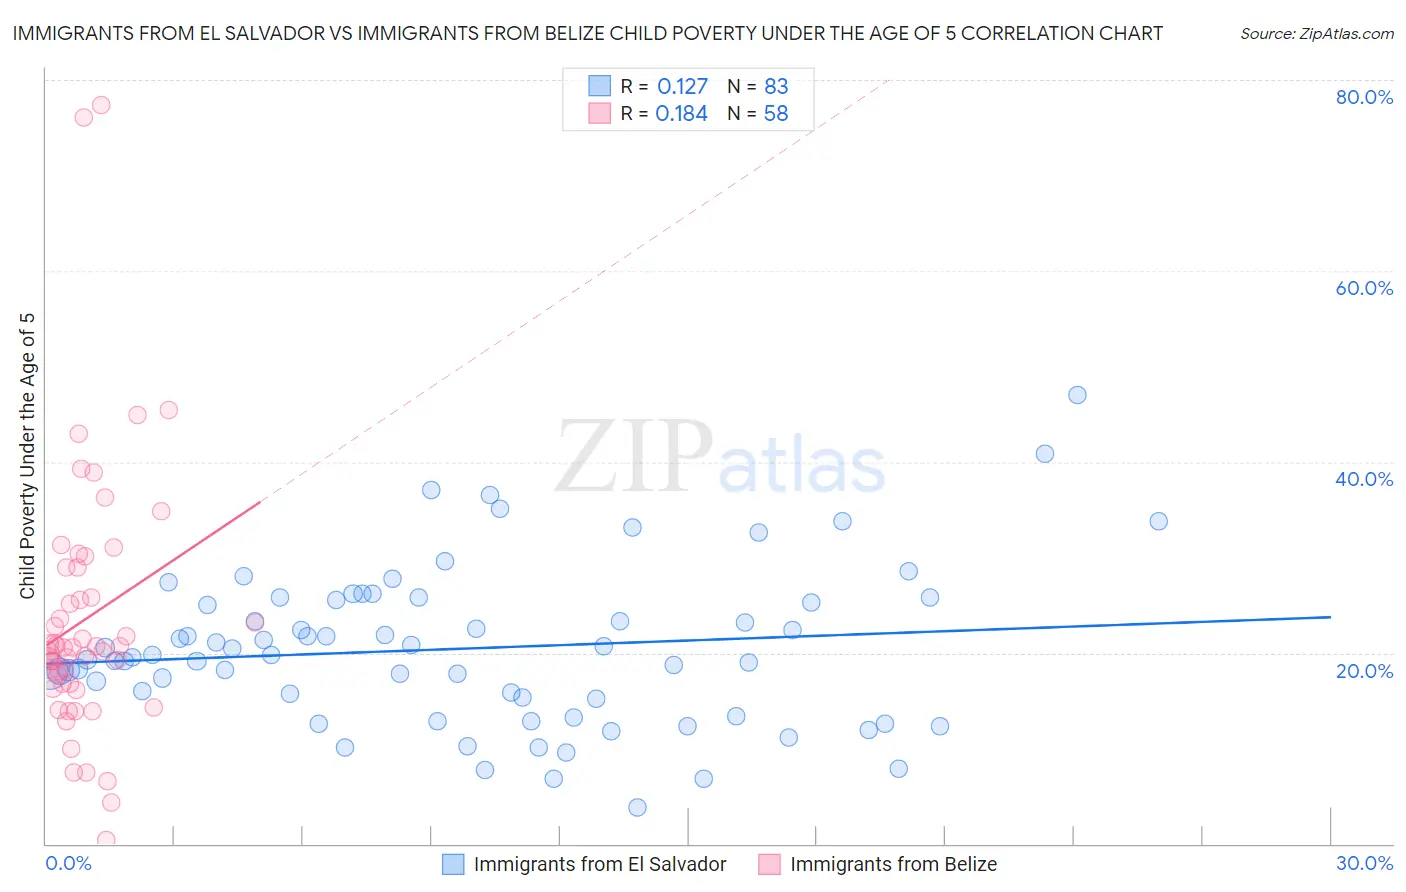
Immigrants from El Salvador vs Immigrants from Belize Child Poverty Under the Age of 5 Correlation Chart
The statistical analysis conducted on geographies consisting of 348,349,886 people shows a poor positive correlation between the proportion of Immigrants from El Salvador and poverty level among children under the age of 5 in the United States with a correlation coefficient (R) of 0.127 and weighted average of 20.0%. Similarly, the statistical analysis conducted on geographies consisting of 129,008,475 people shows a poor positive correlation between the proportion of Immigrants from Belize and poverty level among children under the age of 5 in the United States with a correlation coefficient (R) of 0.184 and weighted average of 20.6%, a difference of 3.1%.
Child Poverty Under the Age of 5 Correlation Summary
| Measurement | Immigrants from El Salvador | Immigrants from Belize |
| Minimum | 3.8% | 0.34% |
| Maximum | 47.0% | 77.4% |
| Range | 43.2% | 77.1% |
| Mean | 20.4% | 23.5% |
| Median | 19.8% | 20.6% |
| Interquartile 25% (IQ1) | 15.2% | 16.8% |
| Interquartile 75% (IQ3) | 25.5% | 28.9% |
| Interquartile Range (IQR) | 10.3% | 12.1% |
| Standard Deviation (Sample) | 8.2% | 13.9% |
| Standard Deviation (Population) | 8.1% | 13.8% |
Demographics Similar to Immigrants from El Salvador and Immigrants from Belize by Child Poverty Under the Age of 5
In terms of child poverty under the age of 5, the demographic groups most similar to Immigrants from El Salvador are Immigrants from St. Vincent and the Grenadines (20.0%, a difference of 0.030%), Shoshone (20.0%, a difference of 0.16%), Immigrants from Barbados (20.0%, a difference of 0.17%), Spanish American (20.1%, a difference of 0.40%), and Immigrants from Bangladesh (20.1%, a difference of 0.44%). Similarly, the demographic groups most similar to Immigrants from Belize are Bangladeshi (20.6%, a difference of 0.050%), Central American (20.6%, a difference of 0.10%), West Indian (20.6%, a difference of 0.14%), Immigrants from Jamaica (20.5%, a difference of 0.62%), and American (20.5%, a difference of 0.74%).
| Demographics | Rating | Rank | Child Poverty Under the Age of 5 |
| Immigrants | Barbados | 0.2 /100 | #256 | Tragic 20.0% |
| Shoshone | 0.2 /100 | #257 | Tragic 20.0% |
| Immigrants | St. Vincent and the Grenadines | 0.2 /100 | #258 | Tragic 20.0% |
| Immigrants | El Salvador | 0.2 /100 | #259 | Tragic 20.0% |
| Spanish Americans | 0.2 /100 | #260 | Tragic 20.1% |
| Immigrants | Bangladesh | 0.2 /100 | #261 | Tragic 20.1% |
| Liberians | 0.1 /100 | #262 | Tragic 20.2% |
| Barbadians | 0.1 /100 | #263 | Tragic 20.2% |
| Immigrants | Liberia | 0.1 /100 | #264 | Tragic 20.2% |
| Spanish American Indians | 0.1 /100 | #265 | Tragic 20.2% |
| Aleuts | 0.1 /100 | #266 | Tragic 20.3% |
| Ottawa | 0.1 /100 | #267 | Tragic 20.3% |
| Belizeans | 0.1 /100 | #268 | Tragic 20.3% |
| Immigrants | Burma/Myanmar | 0.1 /100 | #269 | Tragic 20.4% |
| Jamaicans | 0.1 /100 | #270 | Tragic 20.4% |
| Americans | 0.1 /100 | #271 | Tragic 20.5% |
| Immigrants | Jamaica | 0.1 /100 | #272 | Tragic 20.5% |
| Central Americans | 0.1 /100 | #273 | Tragic 20.6% |
| Immigrants | Belize | 0.1 /100 | #274 | Tragic 20.6% |
| Bangladeshis | 0.1 /100 | #275 | Tragic 20.6% |
| West Indians | 0.0 /100 | #276 | Tragic 20.6% |