Immigrants from Egypt vs Serbian Disability Age Under 5
COMPARE
Immigrants from Egypt
Serbian
Disability Age Under 5
Disability Age Under 5 Comparison
Immigrants from Egypt
Serbians
1.1%
DISABILITY AGE UNDER 5
99.4/ 100
METRIC RATING
58th/ 347
METRIC RANK
1.3%
DISABILITY AGE UNDER 5
9.6/ 100
METRIC RATING
220th/ 347
METRIC RANK
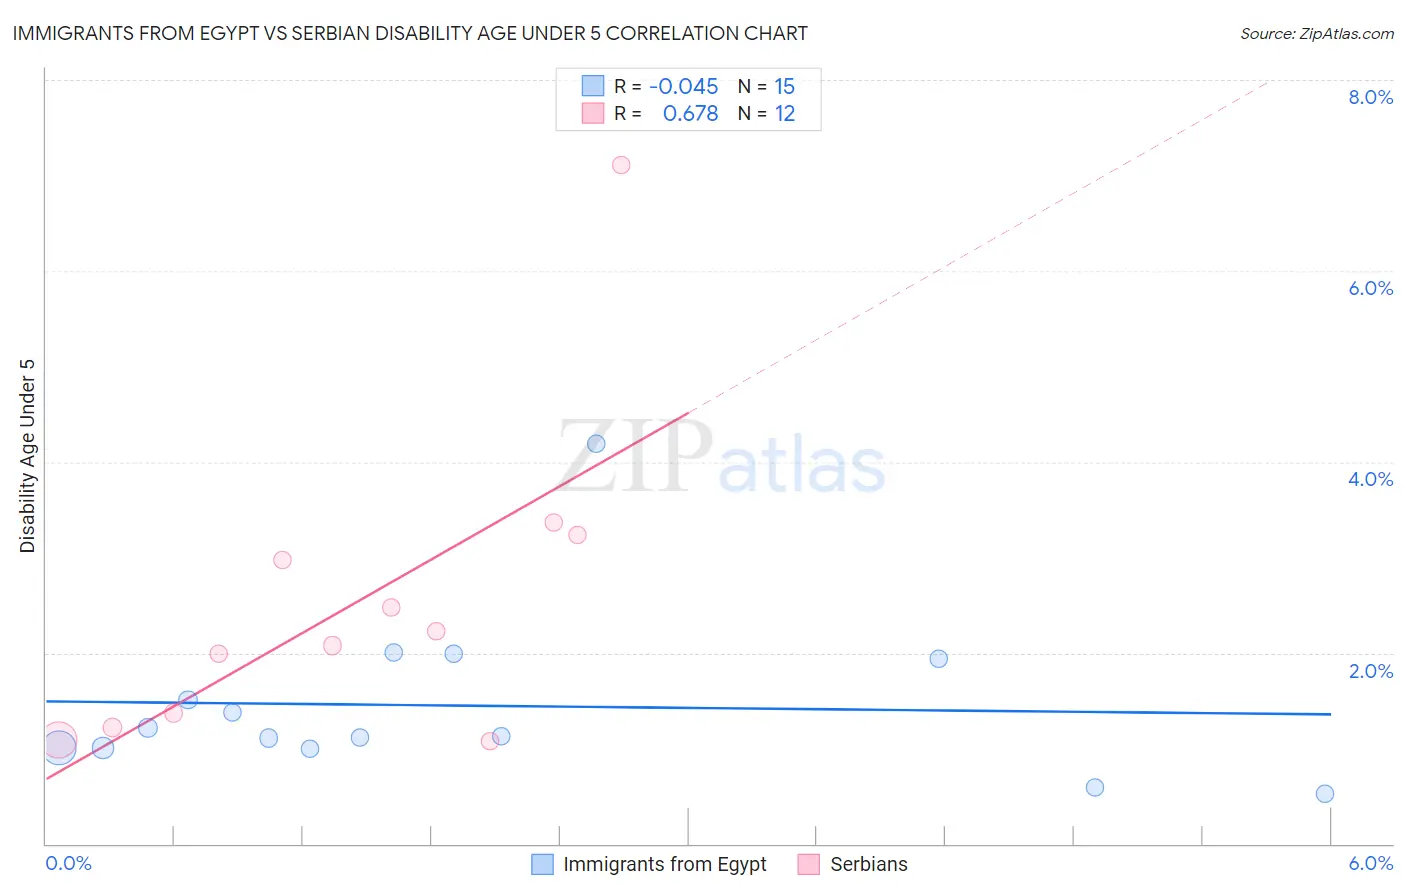
Immigrants from Egypt vs Serbian Disability Age Under 5 Correlation Chart
The statistical analysis conducted on geographies consisting of 152,338,242 people shows no correlation between the proportion of Immigrants from Egypt and percentage of population with a disability under the age of 5 in the United States with a correlation coefficient (R) of -0.045 and weighted average of 1.1%. Similarly, the statistical analysis conducted on geographies consisting of 160,287,389 people shows a significant positive correlation between the proportion of Serbians and percentage of population with a disability under the age of 5 in the United States with a correlation coefficient (R) of 0.678 and weighted average of 1.3%, a difference of 18.9%.
Disability Age Under 5 Correlation Summary
| Measurement | Immigrants from Egypt | Serbian |
| Minimum | 0.53% | 1.1% |
| Maximum | 4.2% | 7.1% |
| Range | 3.7% | 6.0% |
| Mean | 1.4% | 2.5% |
| Median | 1.1% | 2.1% |
| Interquartile 25% (IQ1) | 1.0% | 1.3% |
| Interquartile 75% (IQ3) | 1.9% | 3.1% |
| Interquartile Range (IQR) | 0.94% | 1.8% |
| Standard Deviation (Sample) | 0.89% | 1.7% |
| Standard Deviation (Population) | 0.86% | 1.6% |
Similar Demographics by Disability Age Under 5
Demographics Similar to Immigrants from Egypt by Disability Age Under 5
In terms of disability age under 5, the demographic groups most similar to Immigrants from Egypt are Immigrants from Malaysia (1.1%, a difference of 0.12%), Assyrian/Chaldean/Syriac (1.1%, a difference of 0.19%), Ecuadorian (1.1%, a difference of 0.22%), Salvadoran (1.1%, a difference of 0.61%), and Immigrants from El Salvador (1.1%, a difference of 0.71%).
| Demographics | Rating | Rank | Disability Age Under 5 |
| Immigrants | Kazakhstan | 99.7 /100 | #51 | Exceptional 1.1% |
| Immigrants | Bolivia | 99.6 /100 | #52 | Exceptional 1.1% |
| Asians | 99.6 /100 | #53 | Exceptional 1.1% |
| Immigrants | El Salvador | 99.6 /100 | #54 | Exceptional 1.1% |
| Salvadorans | 99.5 /100 | #55 | Exceptional 1.1% |
| Ecuadorians | 99.5 /100 | #56 | Exceptional 1.1% |
| Assyrians/Chaldeans/Syriacs | 99.5 /100 | #57 | Exceptional 1.1% |
| Immigrants | Egypt | 99.4 /100 | #58 | Exceptional 1.1% |
| Immigrants | Malaysia | 99.4 /100 | #59 | Exceptional 1.1% |
| Immigrants | Western Asia | 99.2 /100 | #60 | Exceptional 1.1% |
| Immigrants | Ethiopia | 99.2 /100 | #61 | Exceptional 1.1% |
| Immigrants | Switzerland | 99.2 /100 | #62 | Exceptional 1.1% |
| Immigrants | Vietnam | 99.1 /100 | #63 | Exceptional 1.1% |
| Egyptians | 98.9 /100 | #64 | Exceptional 1.1% |
| Immigrants | Korea | 98.8 /100 | #65 | Exceptional 1.1% |
Demographics Similar to Serbians by Disability Age Under 5
In terms of disability age under 5, the demographic groups most similar to Serbians are Subsaharan African (1.3%, a difference of 0.34%), Ukrainian (1.3%, a difference of 0.34%), Immigrants from Croatia (1.3%, a difference of 0.37%), Hispanic or Latino (1.3%, a difference of 0.53%), and Latvian (1.3%, a difference of 0.69%).
| Demographics | Rating | Rank | Disability Age Under 5 |
| Immigrants | Sudan | 18.7 /100 | #213 | Poor 1.3% |
| Immigrants | Chile | 17.2 /100 | #214 | Poor 1.3% |
| Syrians | 16.1 /100 | #215 | Poor 1.3% |
| Bangladeshis | 15.5 /100 | #216 | Poor 1.3% |
| Cypriots | 14.9 /100 | #217 | Poor 1.3% |
| Malaysians | 13.2 /100 | #218 | Poor 1.3% |
| Immigrants | Croatia | 11.2 /100 | #219 | Poor 1.3% |
| Serbians | 9.6 /100 | #220 | Tragic 1.3% |
| Sub-Saharan Africans | 8.3 /100 | #221 | Tragic 1.3% |
| Ukrainians | 8.3 /100 | #222 | Tragic 1.3% |
| Hispanics or Latinos | 7.7 /100 | #223 | Tragic 1.3% |
| Latvians | 7.1 /100 | #224 | Tragic 1.3% |
| Panamanians | 7.1 /100 | #225 | Tragic 1.3% |
| Bahamians | 7.1 /100 | #226 | Tragic 1.3% |
| Taiwanese | 6.1 /100 | #227 | Tragic 1.3% |