Immigrants from Egypt vs Immigrants from Canada Disability Age Under 5
COMPARE
Immigrants from Egypt
Immigrants from Canada
Disability Age Under 5
Disability Age Under 5 Comparison
Immigrants from Egypt
Immigrants from Canada
1.1%
DISABILITY AGE UNDER 5
99.4/ 100
METRIC RATING
58th/ 347
METRIC RANK
1.4%
DISABILITY AGE UNDER 5
0.1/ 100
METRIC RATING
271st/ 347
METRIC RANK
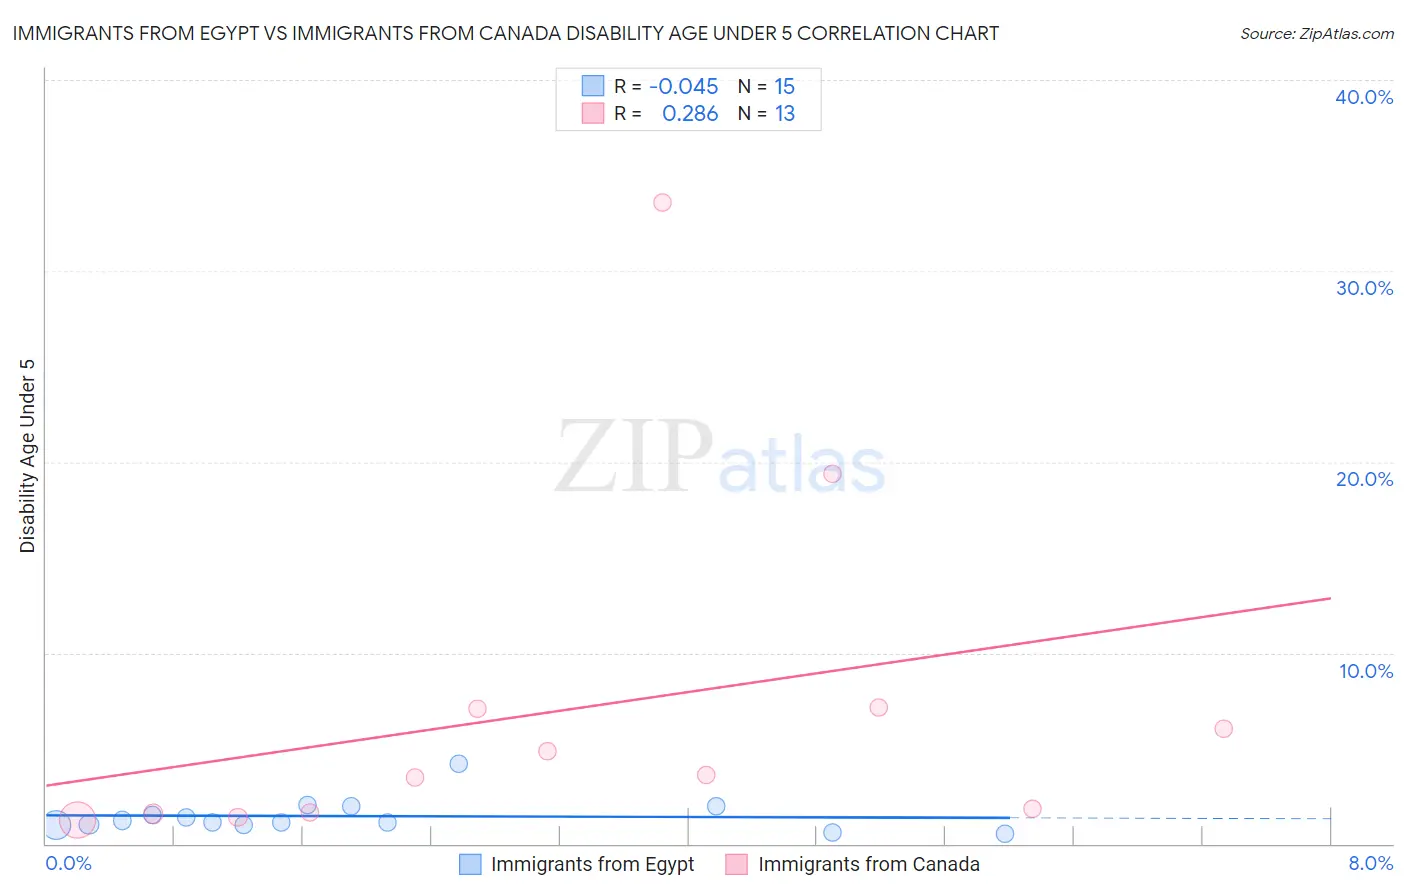
Immigrants from Egypt vs Immigrants from Canada Disability Age Under 5 Correlation Chart
The statistical analysis conducted on geographies consisting of 152,338,242 people shows no correlation between the proportion of Immigrants from Egypt and percentage of population with a disability under the age of 5 in the United States with a correlation coefficient (R) of -0.045 and weighted average of 1.1%. Similarly, the statistical analysis conducted on geographies consisting of 233,728,929 people shows a weak positive correlation between the proportion of Immigrants from Canada and percentage of population with a disability under the age of 5 in the United States with a correlation coefficient (R) of 0.286 and weighted average of 1.4%, a difference of 31.8%.
Disability Age Under 5 Correlation Summary
| Measurement | Immigrants from Egypt | Immigrants from Canada |
| Minimum | 0.53% | 1.3% |
| Maximum | 4.2% | 33.6% |
| Range | 3.7% | 32.3% |
| Mean | 1.4% | 7.1% |
| Median | 1.1% | 3.6% |
| Interquartile 25% (IQ1) | 1.0% | 1.6% |
| Interquartile 75% (IQ3) | 1.9% | 7.1% |
| Interquartile Range (IQR) | 0.94% | 5.5% |
| Standard Deviation (Sample) | 0.89% | 9.3% |
| Standard Deviation (Population) | 0.86% | 8.9% |
Similar Demographics by Disability Age Under 5
Demographics Similar to Immigrants from Egypt by Disability Age Under 5
In terms of disability age under 5, the demographic groups most similar to Immigrants from Egypt are Immigrants from Malaysia (1.1%, a difference of 0.12%), Assyrian/Chaldean/Syriac (1.1%, a difference of 0.19%), Ecuadorian (1.1%, a difference of 0.22%), Salvadoran (1.1%, a difference of 0.61%), and Immigrants from El Salvador (1.1%, a difference of 0.71%).
| Demographics | Rating | Rank | Disability Age Under 5 |
| Immigrants | Kazakhstan | 99.7 /100 | #51 | Exceptional 1.1% |
| Immigrants | Bolivia | 99.6 /100 | #52 | Exceptional 1.1% |
| Asians | 99.6 /100 | #53 | Exceptional 1.1% |
| Immigrants | El Salvador | 99.6 /100 | #54 | Exceptional 1.1% |
| Salvadorans | 99.5 /100 | #55 | Exceptional 1.1% |
| Ecuadorians | 99.5 /100 | #56 | Exceptional 1.1% |
| Assyrians/Chaldeans/Syriacs | 99.5 /100 | #57 | Exceptional 1.1% |
| Immigrants | Egypt | 99.4 /100 | #58 | Exceptional 1.1% |
| Immigrants | Malaysia | 99.4 /100 | #59 | Exceptional 1.1% |
| Immigrants | Western Asia | 99.2 /100 | #60 | Exceptional 1.1% |
| Immigrants | Ethiopia | 99.2 /100 | #61 | Exceptional 1.1% |
| Immigrants | Switzerland | 99.2 /100 | #62 | Exceptional 1.1% |
| Immigrants | Vietnam | 99.1 /100 | #63 | Exceptional 1.1% |
| Egyptians | 98.9 /100 | #64 | Exceptional 1.1% |
| Immigrants | Korea | 98.8 /100 | #65 | Exceptional 1.1% |
Demographics Similar to Immigrants from Canada by Disability Age Under 5
In terms of disability age under 5, the demographic groups most similar to Immigrants from Canada are Immigrants from North America (1.4%, a difference of 0.040%), Black/African American (1.4%, a difference of 0.16%), Austrian (1.4%, a difference of 0.17%), Belgian (1.4%, a difference of 0.35%), and Alaskan Athabascan (1.5%, a difference of 0.46%).
| Demographics | Rating | Rank | Disability Age Under 5 |
| Yugoslavians | 0.1 /100 | #264 | Tragic 1.4% |
| Carpatho Rusyns | 0.1 /100 | #265 | Tragic 1.4% |
| Immigrants | Germany | 0.1 /100 | #266 | Tragic 1.4% |
| Cree | 0.1 /100 | #267 | Tragic 1.4% |
| Belgians | 0.1 /100 | #268 | Tragic 1.4% |
| Austrians | 0.1 /100 | #269 | Tragic 1.4% |
| Immigrants | North America | 0.1 /100 | #270 | Tragic 1.4% |
| Immigrants | Canada | 0.1 /100 | #271 | Tragic 1.4% |
| Blacks/African Americans | 0.1 /100 | #272 | Tragic 1.4% |
| Alaskan Athabascans | 0.1 /100 | #273 | Tragic 1.5% |
| Iroquois | 0.0 /100 | #274 | Tragic 1.5% |
| Brazilians | 0.0 /100 | #275 | Tragic 1.5% |
| Greeks | 0.0 /100 | #276 | Tragic 1.5% |
| Canadians | 0.0 /100 | #277 | Tragic 1.5% |
| Kiowa | 0.0 /100 | #278 | Tragic 1.5% |