Immigrants from Egypt vs Serbian High School Diploma
COMPARE
Immigrants from Egypt
Serbian
High School Diploma
High School Diploma Comparison
Immigrants from Egypt
Serbians
89.6%
HIGH SCHOOL DIPLOMA
81.2/ 100
METRIC RATING
140th/ 347
METRIC RANK
91.1%
HIGH SCHOOL DIPLOMA
99.7/ 100
METRIC RATING
55th/ 347
METRIC RANK
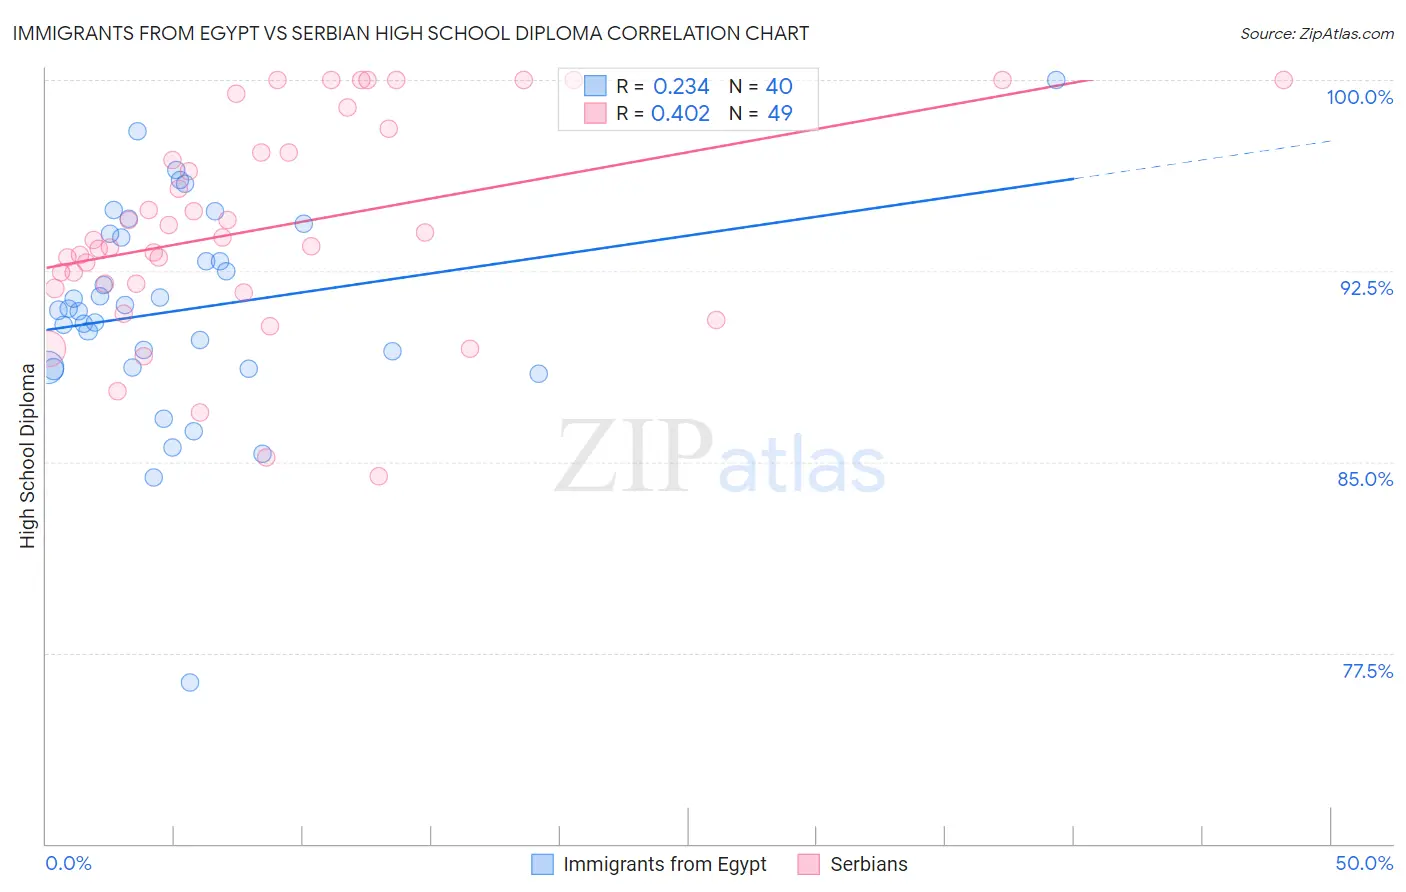
Immigrants from Egypt vs Serbian High School Diploma Correlation Chart
The statistical analysis conducted on geographies consisting of 245,484,455 people shows a weak positive correlation between the proportion of Immigrants from Egypt and percentage of population with at least high school diploma education in the United States with a correlation coefficient (R) of 0.234 and weighted average of 89.6%. Similarly, the statistical analysis conducted on geographies consisting of 267,640,774 people shows a moderate positive correlation between the proportion of Serbians and percentage of population with at least high school diploma education in the United States with a correlation coefficient (R) of 0.402 and weighted average of 91.1%, a difference of 1.6%.
High School Diploma Correlation Summary
| Measurement | Immigrants from Egypt | Serbian |
| Minimum | 76.3% | 84.5% |
| Maximum | 100.0% | 100.0% |
| Range | 23.7% | 15.5% |
| Mean | 91.0% | 94.2% |
| Median | 91.0% | 93.7% |
| Interquartile 25% (IQ1) | 88.7% | 91.9% |
| Interquartile 75% (IQ3) | 93.9% | 97.6% |
| Interquartile Range (IQR) | 5.2% | 5.7% |
| Standard Deviation (Sample) | 4.2% | 4.1% |
| Standard Deviation (Population) | 4.2% | 4.1% |
Similar Demographics by High School Diploma
Demographics Similar to Immigrants from Egypt by High School Diploma
In terms of high school diploma, the demographic groups most similar to Immigrants from Egypt are Kenyan (89.6%, a difference of 0.010%), Assyrian/Chaldean/Syriac (89.7%, a difference of 0.030%), Chilean (89.6%, a difference of 0.050%), Arab (89.7%, a difference of 0.060%), and Indian (Asian) (89.6%, a difference of 0.060%).
| Demographics | Rating | Rank | High School Diploma |
| Albanians | 87.2 /100 | #133 | Excellent 89.8% |
| Immigrants | Jordan | 87.2 /100 | #134 | Excellent 89.8% |
| Chippewa | 85.6 /100 | #135 | Excellent 89.7% |
| Ugandans | 83.7 /100 | #136 | Excellent 89.7% |
| Arabs | 83.6 /100 | #137 | Excellent 89.7% |
| Assyrians/Chaldeans/Syriacs | 82.5 /100 | #138 | Excellent 89.7% |
| Kenyans | 81.4 /100 | #139 | Excellent 89.6% |
| Immigrants | Egypt | 81.2 /100 | #140 | Excellent 89.6% |
| Chileans | 79.0 /100 | #141 | Good 89.6% |
| Indians (Asian) | 78.8 /100 | #142 | Good 89.6% |
| Pakistanis | 78.3 /100 | #143 | Good 89.6% |
| Immigrants | Kenya | 78.0 /100 | #144 | Good 89.6% |
| Immigrants | Brazil | 76.6 /100 | #145 | Good 89.5% |
| Immigrants | Spain | 76.2 /100 | #146 | Good 89.5% |
| Iraqis | 73.9 /100 | #147 | Good 89.5% |
Demographics Similar to Serbians by High School Diploma
In terms of high school diploma, the demographic groups most similar to Serbians are Macedonian (91.1%, a difference of 0.010%), Immigrants from Sweden (91.1%, a difference of 0.030%), Immigrants from Belgium (91.1%, a difference of 0.030%), Immigrants from Canada (91.1%, a difference of 0.030%), and New Zealander (91.1%, a difference of 0.040%).
| Demographics | Rating | Rank | High School Diploma |
| Belgians | 99.8 /100 | #48 | Exceptional 91.2% |
| Bhutanese | 99.8 /100 | #49 | Exceptional 91.2% |
| Welsh | 99.8 /100 | #50 | Exceptional 91.2% |
| New Zealanders | 99.7 /100 | #51 | Exceptional 91.1% |
| Immigrants | Sweden | 99.7 /100 | #52 | Exceptional 91.1% |
| Immigrants | Belgium | 99.7 /100 | #53 | Exceptional 91.1% |
| Macedonians | 99.7 /100 | #54 | Exceptional 91.1% |
| Serbians | 99.7 /100 | #55 | Exceptional 91.1% |
| Immigrants | Canada | 99.7 /100 | #56 | Exceptional 91.1% |
| Zimbabweans | 99.7 /100 | #57 | Exceptional 91.1% |
| Slavs | 99.7 /100 | #58 | Exceptional 91.0% |
| Immigrants | North America | 99.7 /100 | #59 | Exceptional 91.0% |
| Immigrants | Japan | 99.6 /100 | #60 | Exceptional 91.0% |
| Immigrants | Taiwan | 99.6 /100 | #61 | Exceptional 91.0% |
| Austrians | 99.6 /100 | #62 | Exceptional 91.0% |