Burmese vs Serbian Disability Age Under 5
COMPARE
Burmese
Serbian
Disability Age Under 5
Disability Age Under 5 Comparison
Burmese
Serbians
1.1%
DISABILITY AGE UNDER 5
98.5/ 100
METRIC RATING
72nd/ 347
METRIC RANK
1.3%
DISABILITY AGE UNDER 5
9.6/ 100
METRIC RATING
220th/ 347
METRIC RANK
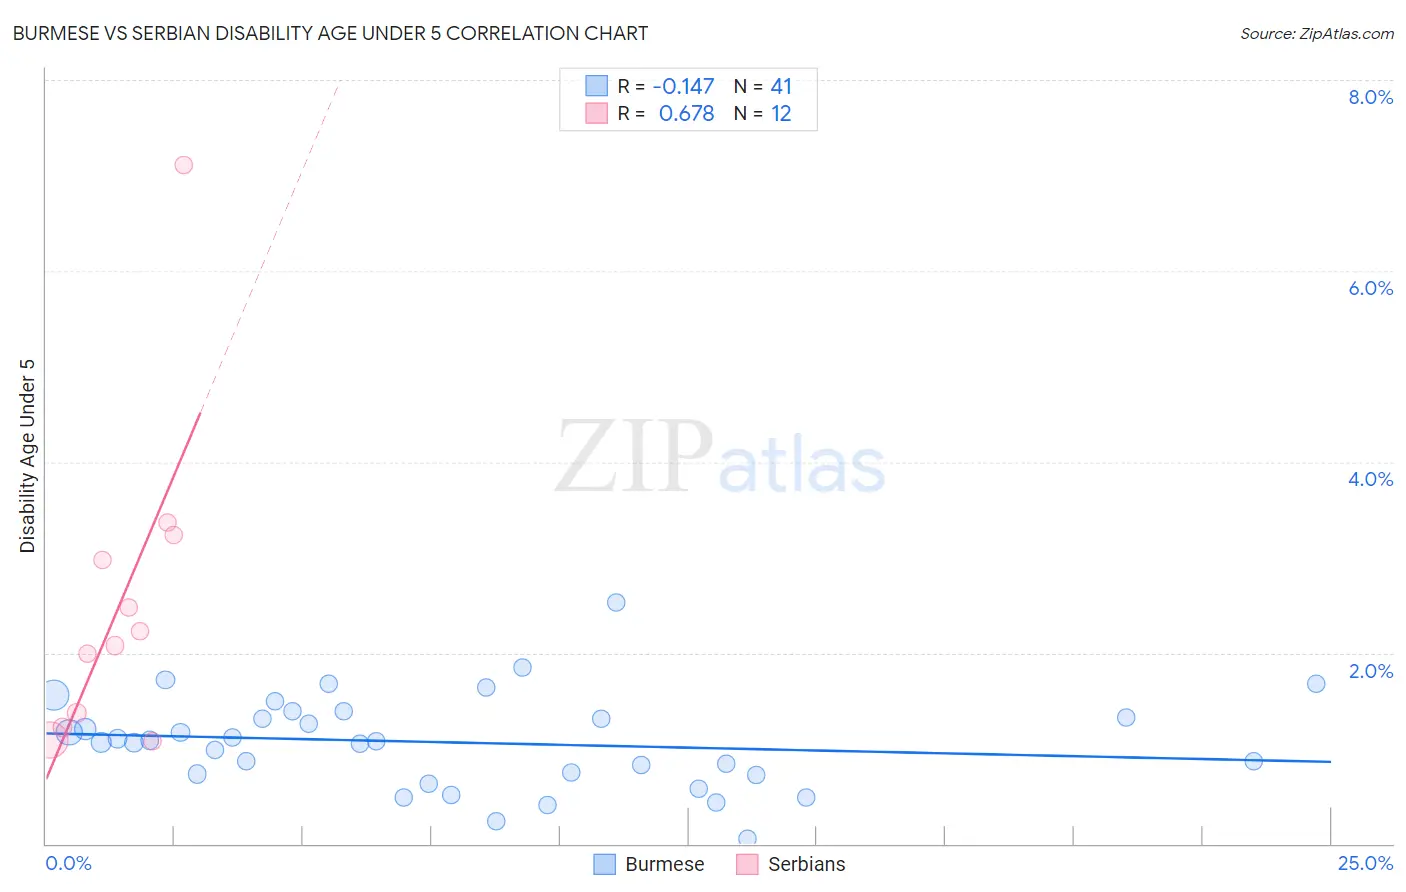
Burmese vs Serbian Disability Age Under 5 Correlation Chart
The statistical analysis conducted on geographies consisting of 238,564,185 people shows a poor negative correlation between the proportion of Burmese and percentage of population with a disability under the age of 5 in the United States with a correlation coefficient (R) of -0.147 and weighted average of 1.1%. Similarly, the statistical analysis conducted on geographies consisting of 160,287,389 people shows a significant positive correlation between the proportion of Serbians and percentage of population with a disability under the age of 5 in the United States with a correlation coefficient (R) of 0.678 and weighted average of 1.3%, a difference of 16.1%.
Disability Age Under 5 Correlation Summary
| Measurement | Burmese | Serbian |
| Minimum | 0.058% | 1.1% |
| Maximum | 2.5% | 7.1% |
| Range | 2.5% | 6.0% |
| Mean | 1.1% | 2.5% |
| Median | 1.1% | 2.1% |
| Interquartile 25% (IQ1) | 0.72% | 1.3% |
| Interquartile 75% (IQ3) | 1.4% | 3.1% |
| Interquartile Range (IQR) | 0.63% | 1.8% |
| Standard Deviation (Sample) | 0.49% | 1.7% |
| Standard Deviation (Population) | 0.48% | 1.6% |
Similar Demographics by Disability Age Under 5
Demographics Similar to Burmese by Disability Age Under 5
In terms of disability age under 5, the demographic groups most similar to Burmese are Immigrants from Sri Lanka (1.1%, a difference of 0.080%), Jordanian (1.1%, a difference of 0.090%), Trinidadian and Tobagonian (1.1%, a difference of 0.16%), Immigrants from Pakistan (1.1%, a difference of 0.17%), and Immigrants from Ecuador (1.1%, a difference of 0.22%).
| Demographics | Rating | Rank | Disability Age Under 5 |
| Immigrants | Korea | 98.8 /100 | #65 | Exceptional 1.1% |
| Immigrants | Indonesia | 98.7 /100 | #66 | Exceptional 1.1% |
| Immigrants | Belize | 98.7 /100 | #67 | Exceptional 1.1% |
| South Africans | 98.7 /100 | #68 | Exceptional 1.1% |
| Israelis | 98.7 /100 | #69 | Exceptional 1.1% |
| Immigrants | Ecuador | 98.6 /100 | #70 | Exceptional 1.1% |
| Trinidadians and Tobagonians | 98.6 /100 | #71 | Exceptional 1.1% |
| Burmese | 98.5 /100 | #72 | Exceptional 1.1% |
| Immigrants | Sri Lanka | 98.5 /100 | #73 | Exceptional 1.1% |
| Jordanians | 98.5 /100 | #74 | Exceptional 1.1% |
| Immigrants | Pakistan | 98.4 /100 | #75 | Exceptional 1.1% |
| Immigrants | Burma/Myanmar | 98.2 /100 | #76 | Exceptional 1.1% |
| Immigrants | Denmark | 98.1 /100 | #77 | Exceptional 1.1% |
| West Indians | 98.0 /100 | #78 | Exceptional 1.1% |
| Hmong | 98.0 /100 | #79 | Exceptional 1.1% |
Demographics Similar to Serbians by Disability Age Under 5
In terms of disability age under 5, the demographic groups most similar to Serbians are Subsaharan African (1.3%, a difference of 0.34%), Ukrainian (1.3%, a difference of 0.34%), Immigrants from Croatia (1.3%, a difference of 0.37%), Hispanic or Latino (1.3%, a difference of 0.53%), and Latvian (1.3%, a difference of 0.69%).
| Demographics | Rating | Rank | Disability Age Under 5 |
| Immigrants | Sudan | 18.7 /100 | #213 | Poor 1.3% |
| Immigrants | Chile | 17.2 /100 | #214 | Poor 1.3% |
| Syrians | 16.1 /100 | #215 | Poor 1.3% |
| Bangladeshis | 15.5 /100 | #216 | Poor 1.3% |
| Cypriots | 14.9 /100 | #217 | Poor 1.3% |
| Malaysians | 13.2 /100 | #218 | Poor 1.3% |
| Immigrants | Croatia | 11.2 /100 | #219 | Poor 1.3% |
| Serbians | 9.6 /100 | #220 | Tragic 1.3% |
| Sub-Saharan Africans | 8.3 /100 | #221 | Tragic 1.3% |
| Ukrainians | 8.3 /100 | #222 | Tragic 1.3% |
| Hispanics or Latinos | 7.7 /100 | #223 | Tragic 1.3% |
| Latvians | 7.1 /100 | #224 | Tragic 1.3% |
| Panamanians | 7.1 /100 | #225 | Tragic 1.3% |
| Bahamians | 7.1 /100 | #226 | Tragic 1.3% |
| Taiwanese | 6.1 /100 | #227 | Tragic 1.3% |