Immigrants from Egypt vs Filipino Disability Age Under 5
COMPARE
Immigrants from Egypt
Filipino
Disability Age Under 5
Disability Age Under 5 Comparison
Immigrants from Egypt
Filipinos
1.1%
DISABILITY AGE UNDER 5
99.4/ 100
METRIC RATING
58th/ 347
METRIC RANK
1.1%
DISABILITY AGE UNDER 5
99.9/ 100
METRIC RATING
39th/ 347
METRIC RANK
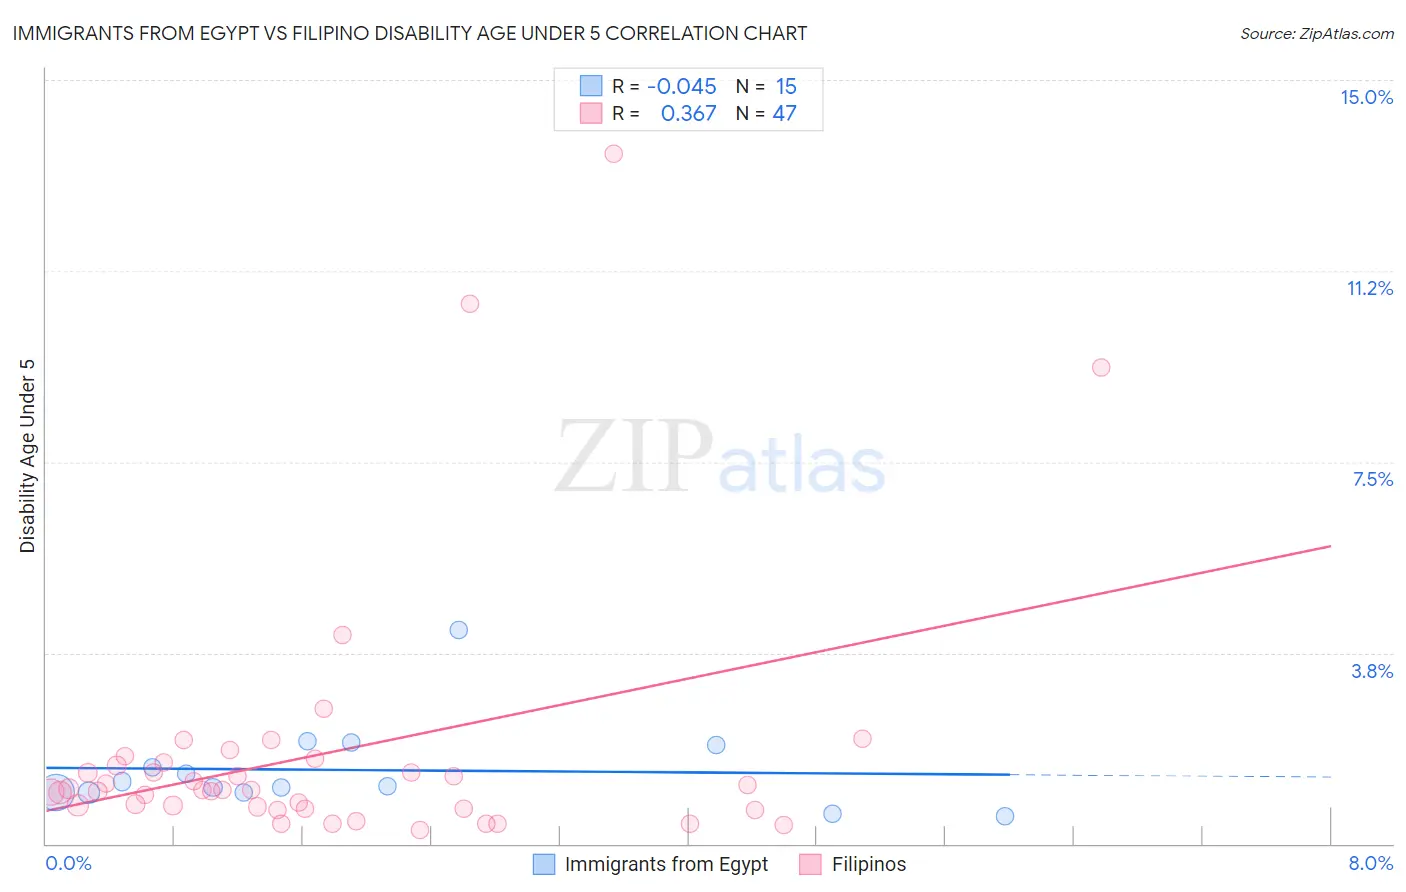
Immigrants from Egypt vs Filipino Disability Age Under 5 Correlation Chart
The statistical analysis conducted on geographies consisting of 152,338,242 people shows no correlation between the proportion of Immigrants from Egypt and percentage of population with a disability under the age of 5 in the United States with a correlation coefficient (R) of -0.045 and weighted average of 1.1%. Similarly, the statistical analysis conducted on geographies consisting of 154,851,342 people shows a mild positive correlation between the proportion of Filipinos and percentage of population with a disability under the age of 5 in the United States with a correlation coefficient (R) of 0.367 and weighted average of 1.1%, a difference of 4.1%.
Disability Age Under 5 Correlation Summary
| Measurement | Immigrants from Egypt | Filipino |
| Minimum | 0.53% | 0.27% |
| Maximum | 4.2% | 13.6% |
| Range | 3.7% | 13.3% |
| Mean | 1.4% | 1.8% |
| Median | 1.1% | 1.1% |
| Interquartile 25% (IQ1) | 1.0% | 0.69% |
| Interquartile 75% (IQ3) | 1.9% | 1.6% |
| Interquartile Range (IQR) | 0.94% | 0.90% |
| Standard Deviation (Sample) | 0.89% | 2.6% |
| Standard Deviation (Population) | 0.86% | 2.6% |
Demographics Similar to Immigrants from Egypt and Filipinos by Disability Age Under 5
In terms of disability age under 5, the demographic groups most similar to Immigrants from Egypt are Assyrian/Chaldean/Syriac (1.1%, a difference of 0.19%), Ecuadorian (1.1%, a difference of 0.22%), Salvadoran (1.1%, a difference of 0.61%), Immigrants from El Salvador (1.1%, a difference of 0.71%), and Asian (1.1%, a difference of 0.99%). Similarly, the demographic groups most similar to Filipinos are Immigrants from Albania (1.1%, a difference of 0.33%), Immigrants from Guyana (1.0%, a difference of 0.67%), Thai (1.1%, a difference of 0.74%), Immigrants from Bulgaria (1.1%, a difference of 0.84%), and Pima (1.1%, a difference of 0.85%).
| Demographics | Rating | Rank | Disability Age Under 5 |
| Immigrants | Guyana | 99.9 /100 | #38 | Exceptional 1.0% |
| Filipinos | 99.9 /100 | #39 | Exceptional 1.1% |
| Immigrants | Albania | 99.9 /100 | #40 | Exceptional 1.1% |
| Thais | 99.8 /100 | #41 | Exceptional 1.1% |
| Immigrants | Bulgaria | 99.8 /100 | #42 | Exceptional 1.1% |
| Pima | 99.8 /100 | #43 | Exceptional 1.1% |
| Immigrants | Asia | 99.8 /100 | #44 | Exceptional 1.1% |
| Immigrants | Turkey | 99.8 /100 | #45 | Exceptional 1.1% |
| Immigrants | Congo | 99.8 /100 | #46 | Exceptional 1.1% |
| Immigrants | Sweden | 99.8 /100 | #47 | Exceptional 1.1% |
| Immigrants | Singapore | 99.7 /100 | #48 | Exceptional 1.1% |
| Immigrants | Russia | 99.7 /100 | #49 | Exceptional 1.1% |
| Immigrants | Japan | 99.7 /100 | #50 | Exceptional 1.1% |
| Immigrants | Kazakhstan | 99.7 /100 | #51 | Exceptional 1.1% |
| Immigrants | Bolivia | 99.6 /100 | #52 | Exceptional 1.1% |
| Asians | 99.6 /100 | #53 | Exceptional 1.1% |
| Immigrants | El Salvador | 99.6 /100 | #54 | Exceptional 1.1% |
| Salvadorans | 99.5 /100 | #55 | Exceptional 1.1% |
| Ecuadorians | 99.5 /100 | #56 | Exceptional 1.1% |
| Assyrians/Chaldeans/Syriacs | 99.5 /100 | #57 | Exceptional 1.1% |
| Immigrants | Egypt | 99.4 /100 | #58 | Exceptional 1.1% |