Immigrants from Ecuador vs Lithuanian Cognitive Disability
COMPARE
Immigrants from Ecuador
Lithuanian
Cognitive Disability
Cognitive Disability Comparison
Immigrants from Ecuador
Lithuanians
17.2%
COGNITIVE DISABILITY
64.4/ 100
METRIC RATING
166th/ 347
METRIC RANK
16.3%
COGNITIVE DISABILITY
100.0/ 100
METRIC RATING
13th/ 347
METRIC RANK
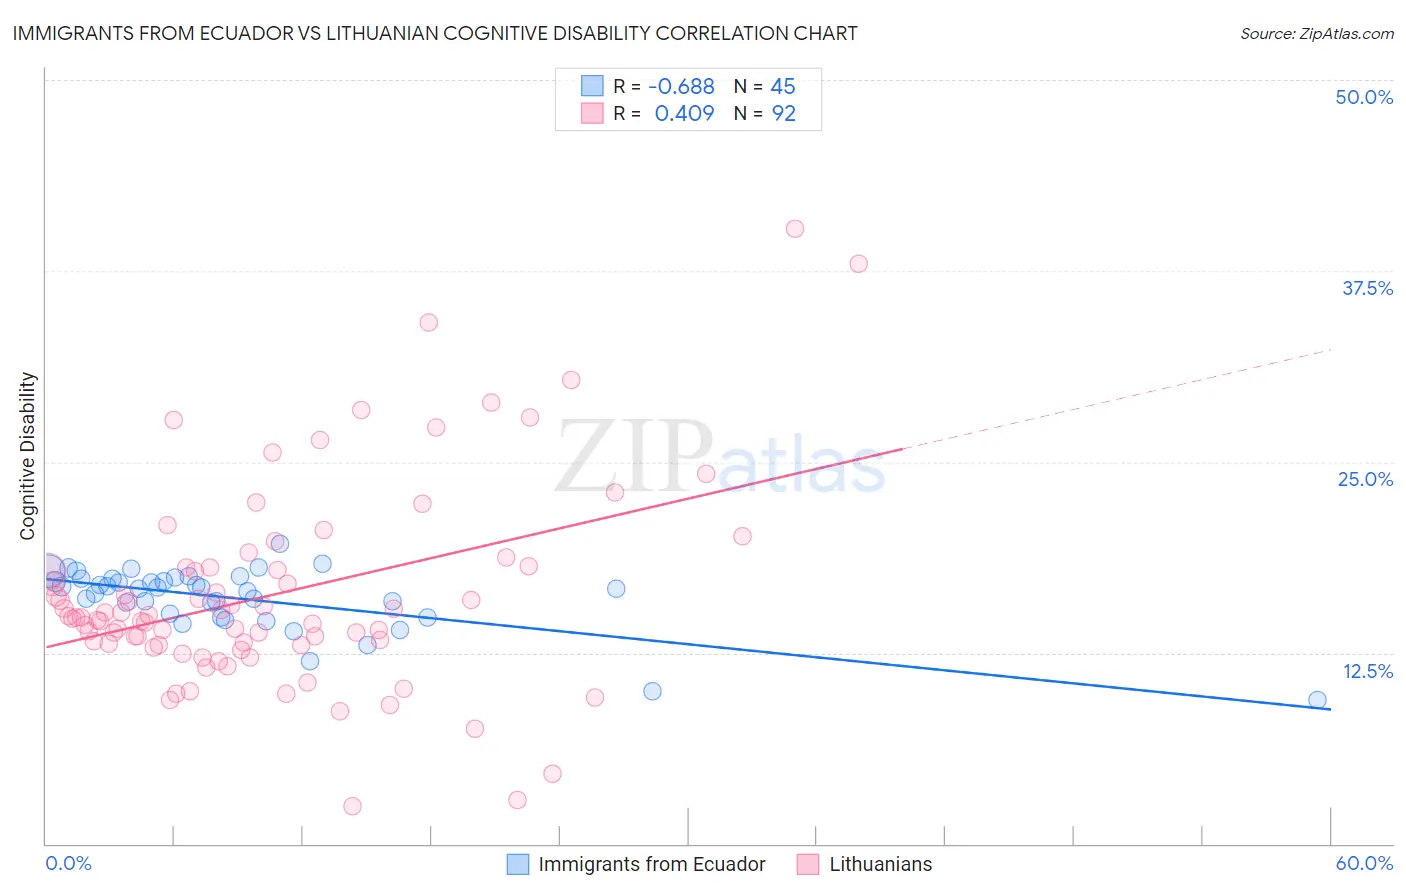
Immigrants from Ecuador vs Lithuanian Cognitive Disability Correlation Chart
The statistical analysis conducted on geographies consisting of 270,972,239 people shows a significant negative correlation between the proportion of Immigrants from Ecuador and percentage of population with cognitive disability in the United States with a correlation coefficient (R) of -0.688 and weighted average of 17.2%. Similarly, the statistical analysis conducted on geographies consisting of 421,943,876 people shows a moderate positive correlation between the proportion of Lithuanians and percentage of population with cognitive disability in the United States with a correlation coefficient (R) of 0.409 and weighted average of 16.3%, a difference of 5.9%.
Cognitive Disability Correlation Summary
| Measurement | Immigrants from Ecuador | Lithuanian |
| Minimum | 9.4% | 2.5% |
| Maximum | 19.7% | 40.3% |
| Range | 10.3% | 37.8% |
| Mean | 16.1% | 16.3% |
| Median | 16.7% | 14.8% |
| Interquartile 25% (IQ1) | 14.9% | 13.1% |
| Interquartile 75% (IQ3) | 17.3% | 18.1% |
| Interquartile Range (IQR) | 2.4% | 5.0% |
| Standard Deviation (Sample) | 2.0% | 6.6% |
| Standard Deviation (Population) | 2.0% | 6.6% |
Similar Demographics by Cognitive Disability
Demographics Similar to Immigrants from Ecuador by Cognitive Disability
In terms of cognitive disability, the demographic groups most similar to Immigrants from Ecuador are Immigrants from Albania (17.2%, a difference of 0.010%), Immigrants from Syria (17.2%, a difference of 0.030%), Immigrants (17.2%, a difference of 0.060%), Immigrants from Portugal (17.2%, a difference of 0.080%), and Ecuadorian (17.2%, a difference of 0.15%).
| Demographics | Rating | Rank | Cognitive Disability |
| Immigrants | Latvia | 73.2 /100 | #159 | Good 17.2% |
| Australians | 72.4 /100 | #160 | Good 17.2% |
| Americans | 72.2 /100 | #161 | Good 17.2% |
| Yugoslavians | 71.6 /100 | #162 | Good 17.2% |
| Immigrants | Switzerland | 71.5 /100 | #163 | Good 17.2% |
| Armenians | 70.1 /100 | #164 | Good 17.2% |
| Immigrants | Albania | 64.9 /100 | #165 | Good 17.2% |
| Immigrants | Ecuador | 64.4 /100 | #166 | Good 17.2% |
| Immigrants | Syria | 63.5 /100 | #167 | Good 17.2% |
| Immigrants | Immigrants | 62.5 /100 | #168 | Good 17.2% |
| Immigrants | Portugal | 61.8 /100 | #169 | Good 17.2% |
| Ecuadorians | 59.6 /100 | #170 | Average 17.2% |
| Tlingit-Haida | 59.4 /100 | #171 | Average 17.2% |
| Immigrants | Turkey | 56.7 /100 | #172 | Average 17.2% |
| Immigrants | Northern Africa | 50.2 /100 | #173 | Average 17.3% |
Demographics Similar to Lithuanians by Cognitive Disability
In terms of cognitive disability, the demographic groups most similar to Lithuanians are Immigrants from Austria (16.3%, a difference of 0.060%), Maltese (16.2%, a difference of 0.090%), Immigrants from Greece (16.3%, a difference of 0.090%), Immigrants from Czechoslovakia (16.2%, a difference of 0.25%), and Immigrants from Scotland (16.2%, a difference of 0.34%).
| Demographics | Rating | Rank | Cognitive Disability |
| Thais | 100.0 /100 | #6 | Exceptional 16.1% |
| Immigrants | Ireland | 100.0 /100 | #7 | Exceptional 16.1% |
| Immigrants | Poland | 100.0 /100 | #8 | Exceptional 16.1% |
| Assyrians/Chaldeans/Syriacs | 100.0 /100 | #9 | Exceptional 16.2% |
| Immigrants | Scotland | 100.0 /100 | #10 | Exceptional 16.2% |
| Immigrants | Czechoslovakia | 100.0 /100 | #11 | Exceptional 16.2% |
| Maltese | 100.0 /100 | #12 | Exceptional 16.2% |
| Lithuanians | 100.0 /100 | #13 | Exceptional 16.3% |
| Immigrants | Austria | 100.0 /100 | #14 | Exceptional 16.3% |
| Immigrants | Greece | 100.0 /100 | #15 | Exceptional 16.3% |
| Eastern Europeans | 100.0 /100 | #16 | Exceptional 16.3% |
| Immigrants | North Macedonia | 100.0 /100 | #17 | Exceptional 16.3% |
| Immigrants | Northern Europe | 100.0 /100 | #18 | Exceptional 16.3% |
| Immigrants | Bolivia | 100.0 /100 | #19 | Exceptional 16.3% |
| Bulgarians | 100.0 /100 | #20 | Exceptional 16.3% |