Immigrants from Eastern Europe vs Choctaw Male Disability
COMPARE
Immigrants from Eastern Europe
Choctaw
Male Disability
Male Disability Comparison
Immigrants from Eastern Europe
Choctaw
10.7%
MALE DISABILITY
95.3/ 100
METRIC RATING
102nd/ 347
METRIC RANK
15.4%
MALE DISABILITY
0.0/ 100
METRIC RATING
341st/ 347
METRIC RANK
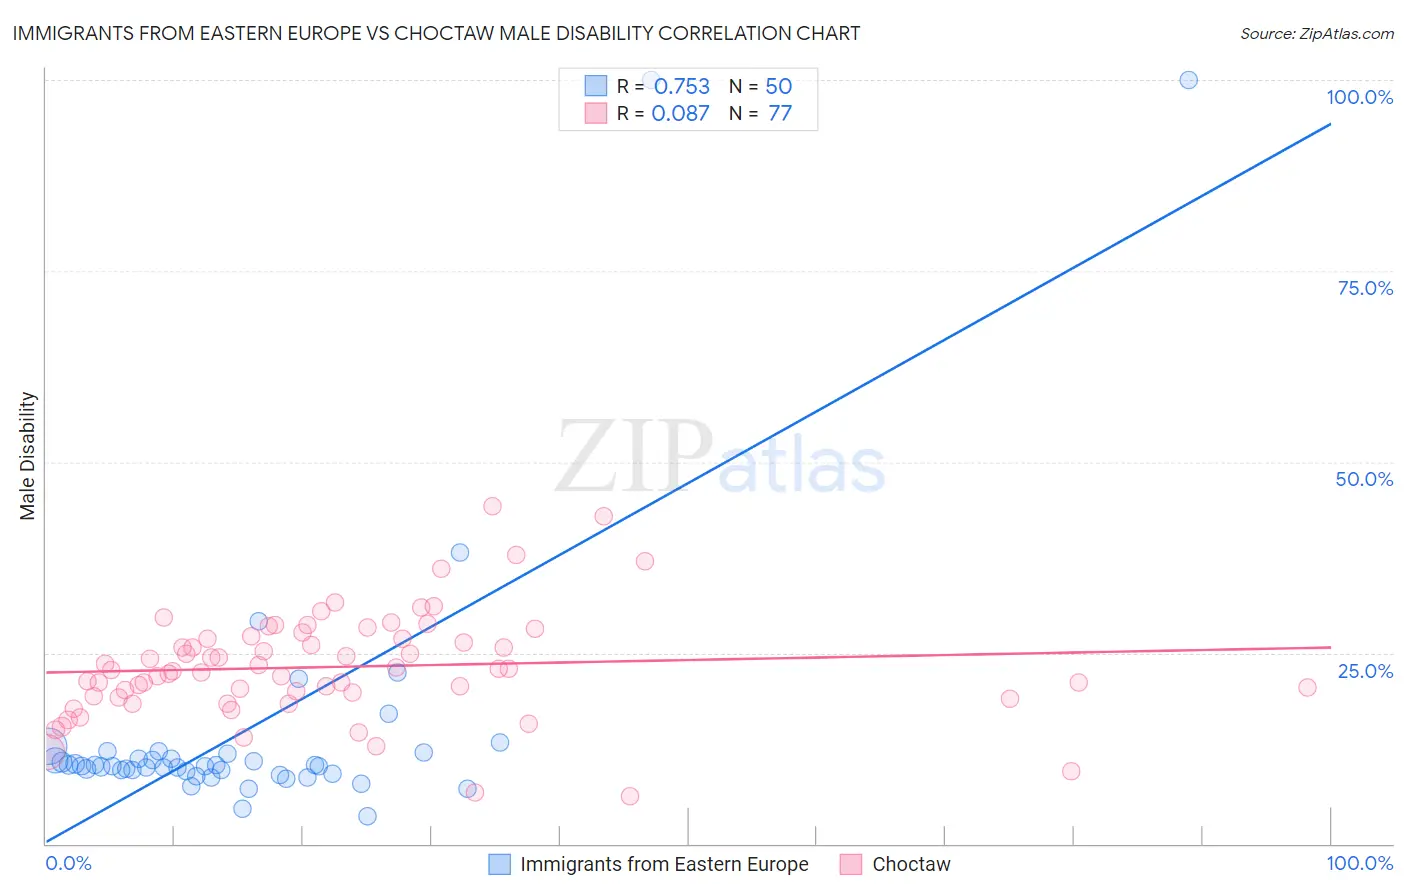
Immigrants from Eastern Europe vs Choctaw Male Disability Correlation Chart
The statistical analysis conducted on geographies consisting of 475,764,615 people shows a strong positive correlation between the proportion of Immigrants from Eastern Europe and percentage of males with a disability in the United States with a correlation coefficient (R) of 0.753 and weighted average of 10.7%. Similarly, the statistical analysis conducted on geographies consisting of 269,660,738 people shows a slight positive correlation between the proportion of Choctaw and percentage of males with a disability in the United States with a correlation coefficient (R) of 0.087 and weighted average of 15.4%, a difference of 43.3%.
Male Disability Correlation Summary
| Measurement | Immigrants from Eastern Europe | Choctaw |
| Minimum | 3.6% | 6.3% |
| Maximum | 100.0% | 44.2% |
| Range | 96.4% | 38.0% |
| Mean | 15.0% | 23.1% |
| Median | 10.2% | 22.8% |
| Interquartile 25% (IQ1) | 9.6% | 19.3% |
| Interquartile 75% (IQ3) | 11.8% | 27.0% |
| Interquartile Range (IQR) | 2.3% | 7.8% |
| Standard Deviation (Sample) | 18.4% | 7.0% |
| Standard Deviation (Population) | 18.2% | 6.9% |
Similar Demographics by Male Disability
Demographics Similar to Immigrants from Eastern Europe by Male Disability
In terms of male disability, the demographic groups most similar to Immigrants from Eastern Europe are Uruguayan (10.7%, a difference of 0.010%), Immigrants from Nigeria (10.8%, a difference of 0.080%), Immigrants from Brazil (10.8%, a difference of 0.090%), Immigrants from Greece (10.7%, a difference of 0.10%), and Immigrants from Syria (10.8%, a difference of 0.13%).
| Demographics | Rating | Rank | Male Disability |
| Chileans | 96.9 /100 | #95 | Exceptional 10.7% |
| Nicaraguans | 96.6 /100 | #96 | Exceptional 10.7% |
| Immigrants | Armenia | 96.6 /100 | #97 | Exceptional 10.7% |
| Immigrants | Romania | 96.5 /100 | #98 | Exceptional 10.7% |
| Immigrants | Switzerland | 96.1 /100 | #99 | Exceptional 10.7% |
| Immigrants | Kazakhstan | 95.9 /100 | #100 | Exceptional 10.7% |
| Immigrants | Greece | 95.6 /100 | #101 | Exceptional 10.7% |
| Immigrants | Eastern Europe | 95.3 /100 | #102 | Exceptional 10.7% |
| Uruguayans | 95.3 /100 | #103 | Exceptional 10.7% |
| Immigrants | Nigeria | 95.1 /100 | #104 | Exceptional 10.8% |
| Immigrants | Brazil | 95.0 /100 | #105 | Exceptional 10.8% |
| Immigrants | Syria | 94.9 /100 | #106 | Exceptional 10.8% |
| Immigrants | Eastern Africa | 94.3 /100 | #107 | Exceptional 10.8% |
| Immigrants | Belgium | 94.2 /100 | #108 | Exceptional 10.8% |
| Immigrants | Uganda | 94.0 /100 | #109 | Exceptional 10.8% |
Demographics Similar to Choctaw by Male Disability
In terms of male disability, the demographic groups most similar to Choctaw are Kiowa (15.4%, a difference of 0.19%), Creek (15.5%, a difference of 0.85%), Puerto Rican (15.6%, a difference of 0.98%), Lumbee (15.2%, a difference of 1.1%), and Tsimshian (15.6%, a difference of 1.3%).
| Demographics | Rating | Rank | Male Disability |
| Yuman | 0.0 /100 | #333 | Tragic 14.7% |
| Cherokee | 0.0 /100 | #334 | Tragic 14.8% |
| Dutch West Indians | 0.0 /100 | #335 | Tragic 14.8% |
| Alaskan Athabascans | 0.0 /100 | #336 | Tragic 14.9% |
| Menominee | 0.0 /100 | #337 | Tragic 15.0% |
| Pueblo | 0.0 /100 | #338 | Tragic 15.0% |
| Chickasaw | 0.0 /100 | #339 | Tragic 15.1% |
| Lumbee | 0.0 /100 | #340 | Tragic 15.2% |
| Choctaw | 0.0 /100 | #341 | Tragic 15.4% |
| Kiowa | 0.0 /100 | #342 | Tragic 15.4% |
| Creek | 0.0 /100 | #343 | Tragic 15.5% |
| Puerto Ricans | 0.0 /100 | #344 | Tragic 15.6% |
| Tsimshian | 0.0 /100 | #345 | Tragic 15.6% |
| Colville | 0.0 /100 | #346 | Tragic 16.5% |
| Houma | 0.0 /100 | #347 | Tragic 17.4% |