Immigrants from Eastern Europe vs Norwegian Ambulatory Disability
COMPARE
Immigrants from Eastern Europe
Norwegian
Ambulatory Disability
Ambulatory Disability Comparison
Immigrants from Eastern Europe
Norwegians
6.0%
AMBULATORY DISABILITY
82.0/ 100
METRIC RATING
148th/ 347
METRIC RANK
5.9%
AMBULATORY DISABILITY
93.1/ 100
METRIC RATING
119th/ 347
METRIC RANK
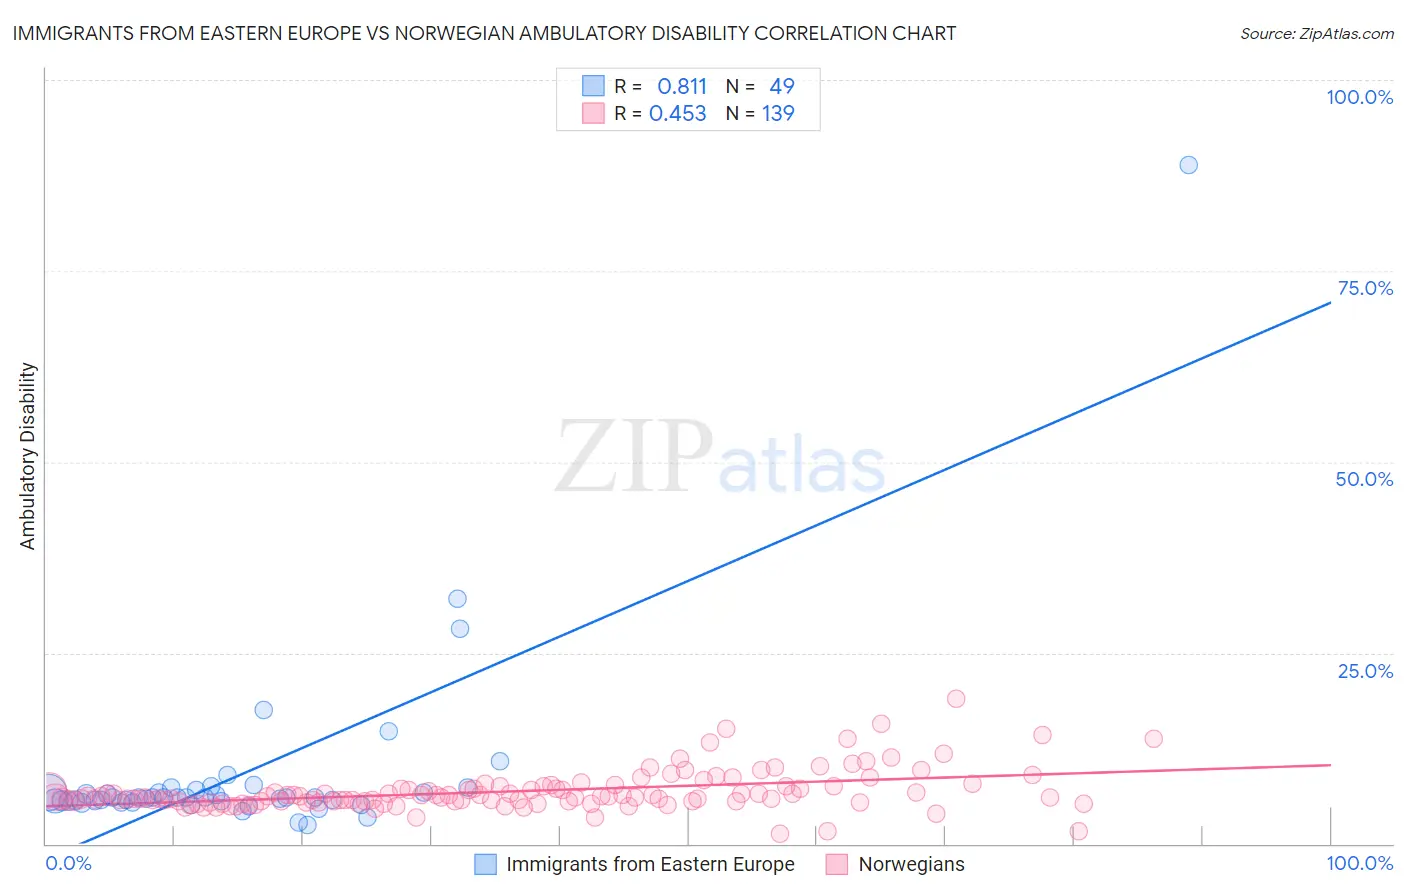
Immigrants from Eastern Europe vs Norwegian Ambulatory Disability Correlation Chart
The statistical analysis conducted on geographies consisting of 475,636,404 people shows a very strong positive correlation between the proportion of Immigrants from Eastern Europe and percentage of population with ambulatory disability in the United States with a correlation coefficient (R) of 0.811 and weighted average of 6.0%. Similarly, the statistical analysis conducted on geographies consisting of 532,951,359 people shows a moderate positive correlation between the proportion of Norwegians and percentage of population with ambulatory disability in the United States with a correlation coefficient (R) of 0.453 and weighted average of 5.9%, a difference of 1.5%.
Ambulatory Disability Correlation Summary
| Measurement | Immigrants from Eastern Europe | Norwegian |
| Minimum | 2.4% | 1.3% |
| Maximum | 88.9% | 18.9% |
| Range | 86.4% | 17.7% |
| Mean | 9.1% | 6.8% |
| Median | 6.0% | 6.1% |
| Interquartile 25% (IQ1) | 5.6% | 5.5% |
| Interquartile 75% (IQ3) | 6.9% | 7.3% |
| Interquartile Range (IQR) | 1.3% | 1.7% |
| Standard Deviation (Sample) | 12.8% | 2.6% |
| Standard Deviation (Population) | 12.7% | 2.6% |
Similar Demographics by Ambulatory Disability
Demographics Similar to Immigrants from Eastern Europe by Ambulatory Disability
In terms of ambulatory disability, the demographic groups most similar to Immigrants from Eastern Europe are Lithuanian (6.0%, a difference of 0.010%), Maltese (6.0%, a difference of 0.030%), Immigrants from Moldova (6.0%, a difference of 0.040%), Pakistani (6.0%, a difference of 0.050%), and Immigrants from Greece (6.0%, a difference of 0.050%).
| Demographics | Rating | Rank | Ambulatory Disability |
| Swedes | 83.1 /100 | #141 | Excellent 6.0% |
| Immigrants | Philippines | 83.0 /100 | #142 | Excellent 6.0% |
| Romanians | 82.9 /100 | #143 | Excellent 6.0% |
| Macedonians | 82.8 /100 | #144 | Excellent 6.0% |
| Pakistanis | 82.5 /100 | #145 | Excellent 6.0% |
| Immigrants | Greece | 82.5 /100 | #146 | Excellent 6.0% |
| Immigrants | Moldova | 82.4 /100 | #147 | Excellent 6.0% |
| Immigrants | Eastern Europe | 82.0 /100 | #148 | Excellent 6.0% |
| Lithuanians | 81.9 /100 | #149 | Excellent 6.0% |
| Maltese | 81.6 /100 | #150 | Excellent 6.0% |
| Greeks | 79.6 /100 | #151 | Good 6.0% |
| Immigrants | Austria | 78.8 /100 | #152 | Good 6.0% |
| Syrians | 75.5 /100 | #153 | Good 6.0% |
| Immigrants | Croatia | 75.1 /100 | #154 | Good 6.0% |
| Immigrants | Scotland | 72.1 /100 | #155 | Good 6.0% |
Demographics Similar to Norwegians by Ambulatory Disability
In terms of ambulatory disability, the demographic groups most similar to Norwegians are Estonian (5.9%, a difference of 0.040%), Russian (5.9%, a difference of 0.080%), Immigrants from South Eastern Asia (5.9%, a difference of 0.11%), Costa Rican (5.9%, a difference of 0.11%), and Icelander (5.9%, a difference of 0.11%).
| Demographics | Rating | Rank | Ambulatory Disability |
| South Africans | 96.3 /100 | #112 | Exceptional 5.9% |
| Immigrants | Uruguay | 95.6 /100 | #113 | Exceptional 5.9% |
| Immigrants | Poland | 95.4 /100 | #114 | Exceptional 5.9% |
| South American Indians | 94.8 /100 | #115 | Exceptional 5.9% |
| Immigrants | Africa | 94.7 /100 | #116 | Exceptional 5.9% |
| Immigrants | South Eastern Asia | 93.6 /100 | #117 | Exceptional 5.9% |
| Russians | 93.4 /100 | #118 | Exceptional 5.9% |
| Norwegians | 93.1 /100 | #119 | Exceptional 5.9% |
| Estonians | 92.9 /100 | #120 | Exceptional 5.9% |
| Costa Ricans | 92.6 /100 | #121 | Exceptional 5.9% |
| Icelanders | 92.6 /100 | #122 | Exceptional 5.9% |
| Immigrants | Russia | 92.4 /100 | #123 | Exceptional 5.9% |
| Immigrants | Middle Africa | 92.2 /100 | #124 | Exceptional 5.9% |
| Koreans | 91.6 /100 | #125 | Exceptional 5.9% |
| Arabs | 91.5 /100 | #126 | Exceptional 5.9% |