Immigrants from Eastern Europe vs Immigrants from Nepal Ambulatory Disability
COMPARE
Immigrants from Eastern Europe
Immigrants from Nepal
Ambulatory Disability
Ambulatory Disability Comparison
Immigrants from Eastern Europe
Immigrants from Nepal
6.0%
AMBULATORY DISABILITY
82.0/ 100
METRIC RATING
148th/ 347
METRIC RANK
5.4%
AMBULATORY DISABILITY
100.0/ 100
METRIC RATING
26th/ 347
METRIC RANK
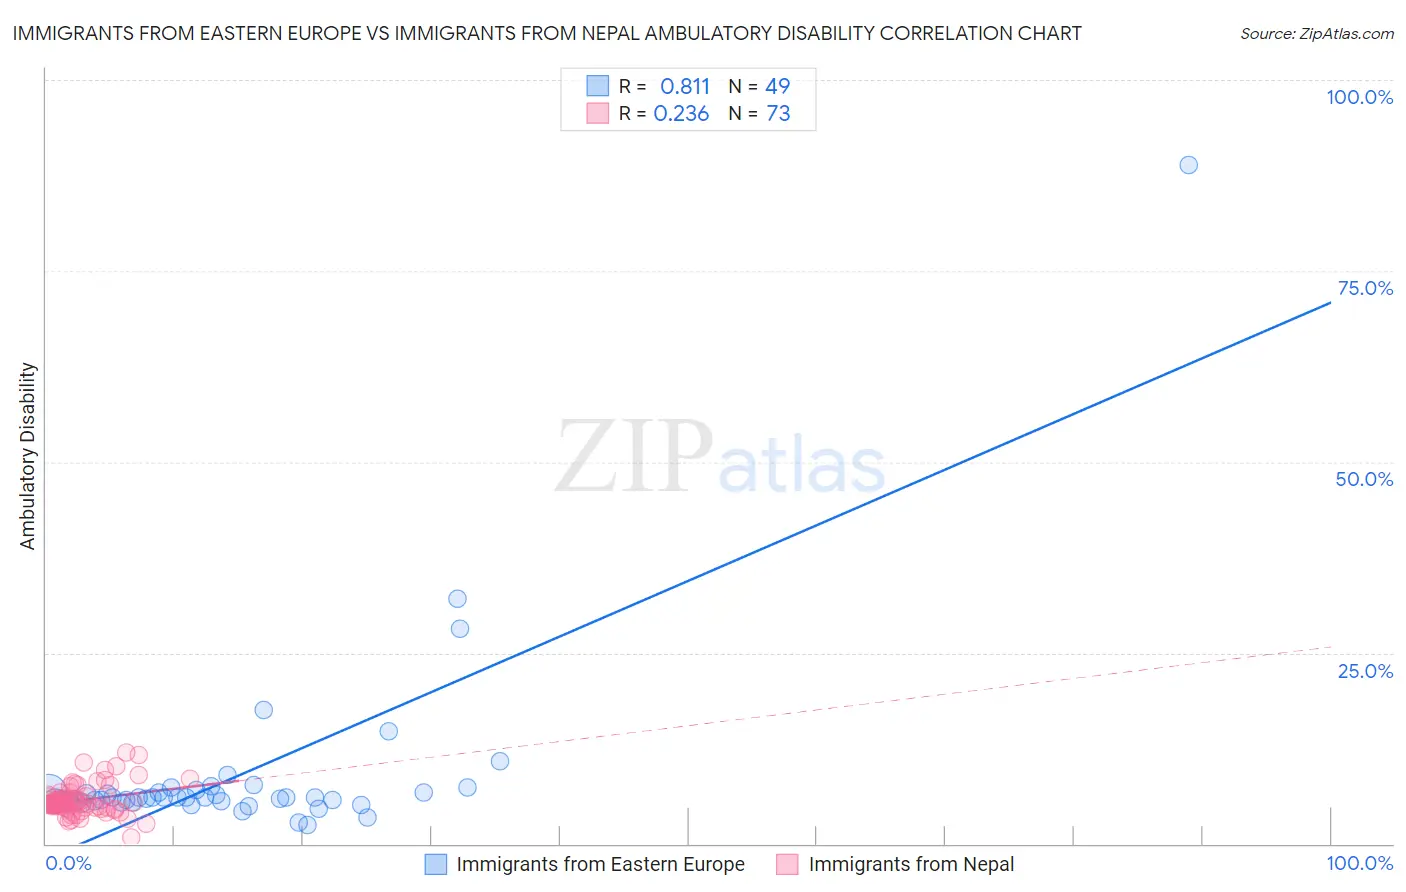
Immigrants from Eastern Europe vs Immigrants from Nepal Ambulatory Disability Correlation Chart
The statistical analysis conducted on geographies consisting of 475,636,404 people shows a very strong positive correlation between the proportion of Immigrants from Eastern Europe and percentage of population with ambulatory disability in the United States with a correlation coefficient (R) of 0.811 and weighted average of 6.0%. Similarly, the statistical analysis conducted on geographies consisting of 186,771,176 people shows a weak positive correlation between the proportion of Immigrants from Nepal and percentage of population with ambulatory disability in the United States with a correlation coefficient (R) of 0.236 and weighted average of 5.4%, a difference of 11.1%.
Ambulatory Disability Correlation Summary
| Measurement | Immigrants from Eastern Europe | Immigrants from Nepal |
| Minimum | 2.4% | 0.79% |
| Maximum | 88.9% | 11.9% |
| Range | 86.4% | 11.1% |
| Mean | 9.1% | 5.7% |
| Median | 6.0% | 5.3% |
| Interquartile 25% (IQ1) | 5.6% | 4.7% |
| Interquartile 75% (IQ3) | 6.9% | 6.1% |
| Interquartile Range (IQR) | 1.3% | 1.3% |
| Standard Deviation (Sample) | 12.8% | 2.0% |
| Standard Deviation (Population) | 12.7% | 2.0% |
Similar Demographics by Ambulatory Disability
Demographics Similar to Immigrants from Eastern Europe by Ambulatory Disability
In terms of ambulatory disability, the demographic groups most similar to Immigrants from Eastern Europe are Lithuanian (6.0%, a difference of 0.010%), Maltese (6.0%, a difference of 0.030%), Immigrants from Moldova (6.0%, a difference of 0.040%), Pakistani (6.0%, a difference of 0.050%), and Immigrants from Greece (6.0%, a difference of 0.050%).
| Demographics | Rating | Rank | Ambulatory Disability |
| Swedes | 83.1 /100 | #141 | Excellent 6.0% |
| Immigrants | Philippines | 83.0 /100 | #142 | Excellent 6.0% |
| Romanians | 82.9 /100 | #143 | Excellent 6.0% |
| Macedonians | 82.8 /100 | #144 | Excellent 6.0% |
| Pakistanis | 82.5 /100 | #145 | Excellent 6.0% |
| Immigrants | Greece | 82.5 /100 | #146 | Excellent 6.0% |
| Immigrants | Moldova | 82.4 /100 | #147 | Excellent 6.0% |
| Immigrants | Eastern Europe | 82.0 /100 | #148 | Excellent 6.0% |
| Lithuanians | 81.9 /100 | #149 | Excellent 6.0% |
| Maltese | 81.6 /100 | #150 | Excellent 6.0% |
| Greeks | 79.6 /100 | #151 | Good 6.0% |
| Immigrants | Austria | 78.8 /100 | #152 | Good 6.0% |
| Syrians | 75.5 /100 | #153 | Good 6.0% |
| Immigrants | Croatia | 75.1 /100 | #154 | Good 6.0% |
| Immigrants | Scotland | 72.1 /100 | #155 | Good 6.0% |
Demographics Similar to Immigrants from Nepal by Ambulatory Disability
In terms of ambulatory disability, the demographic groups most similar to Immigrants from Nepal are Zimbabwean (5.4%, a difference of 0.030%), Immigrants from Saudi Arabia (5.4%, a difference of 0.11%), Asian (5.4%, a difference of 0.16%), Tongan (5.4%, a difference of 0.20%), and Cambodian (5.4%, a difference of 0.22%).
| Demographics | Rating | Rank | Ambulatory Disability |
| Indians (Asian) | 100.0 /100 | #19 | Exceptional 5.4% |
| Ethiopians | 100.0 /100 | #20 | Exceptional 5.4% |
| Immigrants | Kuwait | 100.0 /100 | #21 | Exceptional 5.4% |
| Immigrants | Israel | 100.0 /100 | #22 | Exceptional 5.4% |
| Tongans | 100.0 /100 | #23 | Exceptional 5.4% |
| Immigrants | Saudi Arabia | 100.0 /100 | #24 | Exceptional 5.4% |
| Zimbabweans | 100.0 /100 | #25 | Exceptional 5.4% |
| Immigrants | Nepal | 100.0 /100 | #26 | Exceptional 5.4% |
| Asians | 100.0 /100 | #27 | Exceptional 5.4% |
| Cambodians | 100.0 /100 | #28 | Exceptional 5.4% |
| Immigrants | Iran | 100.0 /100 | #29 | Exceptional 5.4% |
| Immigrants | Turkey | 100.0 /100 | #30 | Exceptional 5.4% |
| Immigrants | Venezuela | 100.0 /100 | #31 | Exceptional 5.4% |
| Immigrants | Australia | 100.0 /100 | #32 | Exceptional 5.5% |
| Immigrants | Pakistan | 100.0 /100 | #33 | Exceptional 5.5% |