Immigrants from Eastern Europe vs Immigrants from St. Vincent and the Grenadines Ambulatory Disability
COMPARE
Immigrants from Eastern Europe
Immigrants from St. Vincent and the Grenadines
Ambulatory Disability
Ambulatory Disability Comparison
Immigrants from Eastern Europe
Immigrants from St. Vincent and the Grenadines
6.0%
AMBULATORY DISABILITY
82.0/ 100
METRIC RATING
148th/ 347
METRIC RANK
6.9%
AMBULATORY DISABILITY
0.0/ 100
METRIC RATING
293rd/ 347
METRIC RANK
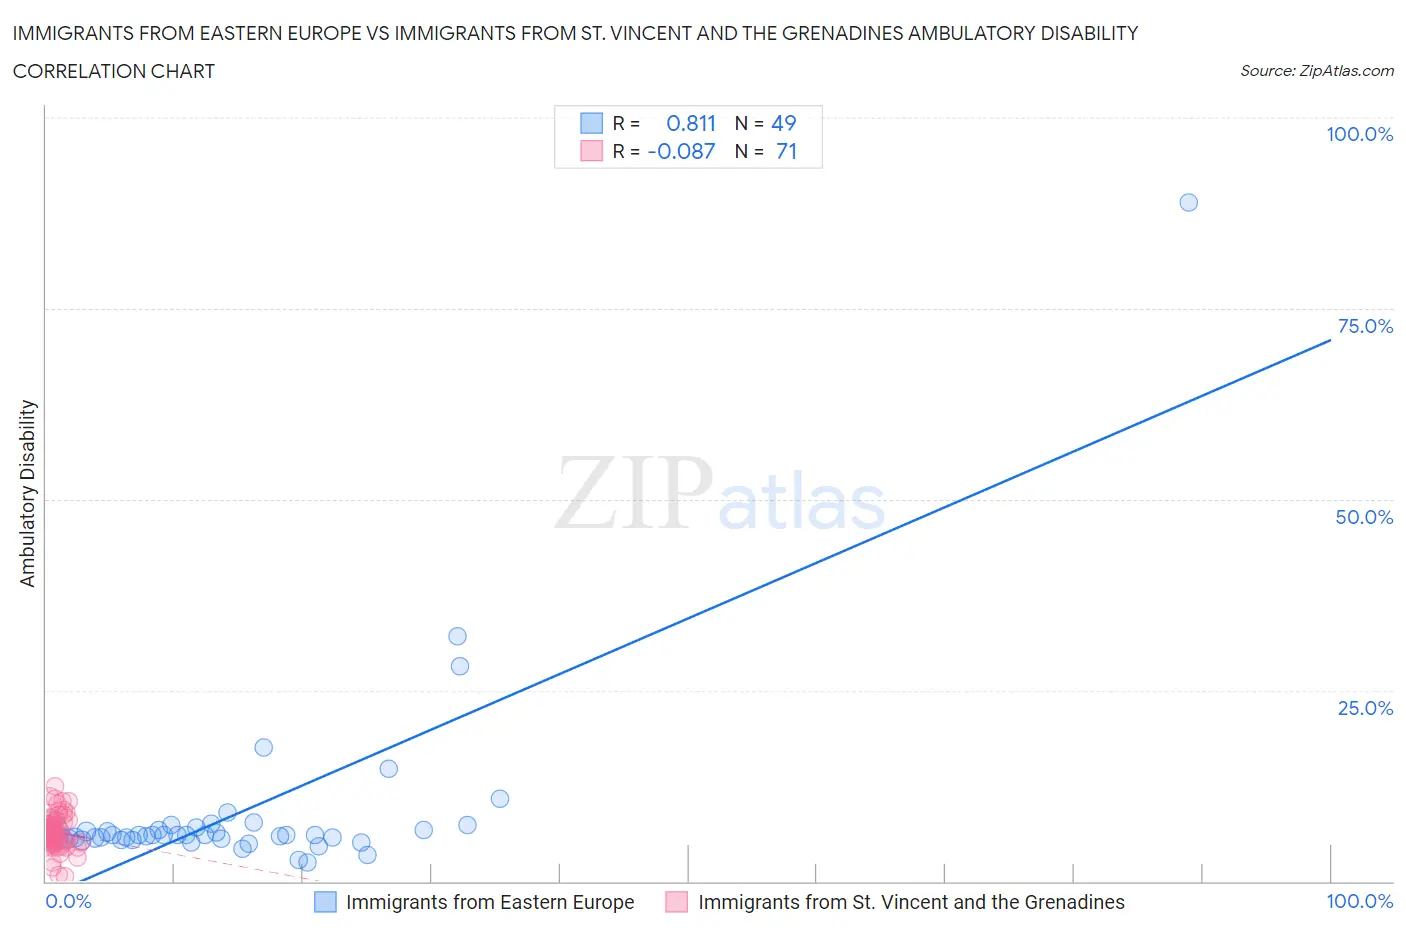
Immigrants from Eastern Europe vs Immigrants from St. Vincent and the Grenadines Ambulatory Disability Correlation Chart
The statistical analysis conducted on geographies consisting of 475,636,404 people shows a very strong positive correlation between the proportion of Immigrants from Eastern Europe and percentage of population with ambulatory disability in the United States with a correlation coefficient (R) of 0.811 and weighted average of 6.0%. Similarly, the statistical analysis conducted on geographies consisting of 56,172,831 people shows a slight negative correlation between the proportion of Immigrants from St. Vincent and the Grenadines and percentage of population with ambulatory disability in the United States with a correlation coefficient (R) of -0.087 and weighted average of 6.9%, a difference of 14.9%.
Ambulatory Disability Correlation Summary
| Measurement | Immigrants from Eastern Europe | Immigrants from St. Vincent and the Grenadines |
| Minimum | 2.4% | 0.61% |
| Maximum | 88.9% | 12.4% |
| Range | 86.4% | 11.8% |
| Mean | 9.1% | 6.5% |
| Median | 6.0% | 6.5% |
| Interquartile 25% (IQ1) | 5.6% | 5.0% |
| Interquartile 75% (IQ3) | 6.9% | 7.5% |
| Interquartile Range (IQR) | 1.3% | 2.5% |
| Standard Deviation (Sample) | 12.8% | 2.2% |
| Standard Deviation (Population) | 12.7% | 2.2% |
Similar Demographics by Ambulatory Disability
Demographics Similar to Immigrants from Eastern Europe by Ambulatory Disability
In terms of ambulatory disability, the demographic groups most similar to Immigrants from Eastern Europe are Lithuanian (6.0%, a difference of 0.010%), Maltese (6.0%, a difference of 0.030%), Immigrants from Moldova (6.0%, a difference of 0.040%), Pakistani (6.0%, a difference of 0.050%), and Immigrants from Greece (6.0%, a difference of 0.050%).
| Demographics | Rating | Rank | Ambulatory Disability |
| Swedes | 83.1 /100 | #141 | Excellent 6.0% |
| Immigrants | Philippines | 83.0 /100 | #142 | Excellent 6.0% |
| Romanians | 82.9 /100 | #143 | Excellent 6.0% |
| Macedonians | 82.8 /100 | #144 | Excellent 6.0% |
| Pakistanis | 82.5 /100 | #145 | Excellent 6.0% |
| Immigrants | Greece | 82.5 /100 | #146 | Excellent 6.0% |
| Immigrants | Moldova | 82.4 /100 | #147 | Excellent 6.0% |
| Immigrants | Eastern Europe | 82.0 /100 | #148 | Excellent 6.0% |
| Lithuanians | 81.9 /100 | #149 | Excellent 6.0% |
| Maltese | 81.6 /100 | #150 | Excellent 6.0% |
| Greeks | 79.6 /100 | #151 | Good 6.0% |
| Immigrants | Austria | 78.8 /100 | #152 | Good 6.0% |
| Syrians | 75.5 /100 | #153 | Good 6.0% |
| Immigrants | Croatia | 75.1 /100 | #154 | Good 6.0% |
| Immigrants | Scotland | 72.1 /100 | #155 | Good 6.0% |
Demographics Similar to Immigrants from St. Vincent and the Grenadines by Ambulatory Disability
In terms of ambulatory disability, the demographic groups most similar to Immigrants from St. Vincent and the Grenadines are Cape Verdean (6.9%, a difference of 0.19%), Cheyenne (6.9%, a difference of 0.24%), Crow (6.9%, a difference of 0.26%), West Indian (6.9%, a difference of 0.30%), and Scotch-Irish (6.9%, a difference of 0.40%).
| Demographics | Rating | Rank | Ambulatory Disability |
| Yakama | 0.0 /100 | #286 | Tragic 6.8% |
| U.S. Virgin Islanders | 0.0 /100 | #287 | Tragic 6.8% |
| Immigrants | Nonimmigrants | 0.0 /100 | #288 | Tragic 6.9% |
| Immigrants | Dominica | 0.0 /100 | #289 | Tragic 6.9% |
| Scotch-Irish | 0.0 /100 | #290 | Tragic 6.9% |
| West Indians | 0.0 /100 | #291 | Tragic 6.9% |
| Cheyenne | 0.0 /100 | #292 | Tragic 6.9% |
| Immigrants | St. Vincent and the Grenadines | 0.0 /100 | #293 | Tragic 6.9% |
| Cape Verdeans | 0.0 /100 | #294 | Tragic 6.9% |
| Crow | 0.0 /100 | #295 | Tragic 6.9% |
| Alaskan Athabascans | 0.0 /100 | #296 | Tragic 6.9% |
| French American Indians | 0.0 /100 | #297 | Tragic 6.9% |
| Immigrants | Grenada | 0.0 /100 | #298 | Tragic 6.9% |
| Puget Sound Salish | 0.0 /100 | #299 | Tragic 6.9% |
| Marshallese | 0.0 /100 | #300 | Tragic 6.9% |