Immigrants from Zaire vs Norwegian Ambulatory Disability
COMPARE
Immigrants from Zaire
Norwegian
Ambulatory Disability
Ambulatory Disability Comparison
Immigrants from Zaire
Norwegians
6.0%
AMBULATORY DISABILITY
83.6/ 100
METRIC RATING
139th/ 347
METRIC RANK
5.9%
AMBULATORY DISABILITY
93.1/ 100
METRIC RATING
119th/ 347
METRIC RANK
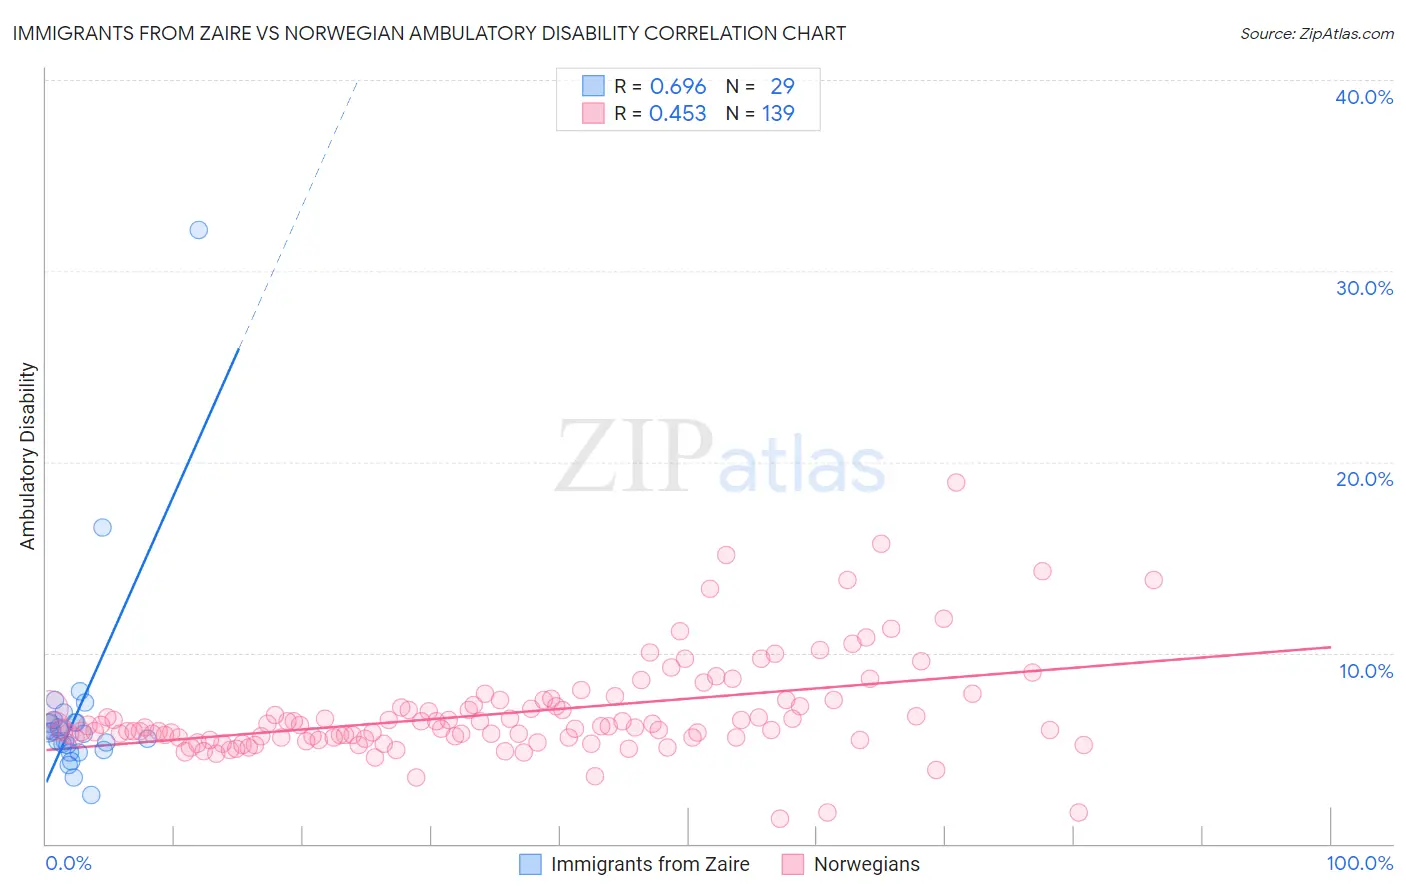
Immigrants from Zaire vs Norwegian Ambulatory Disability Correlation Chart
The statistical analysis conducted on geographies consisting of 107,247,600 people shows a significant positive correlation between the proportion of Immigrants from Zaire and percentage of population with ambulatory disability in the United States with a correlation coefficient (R) of 0.696 and weighted average of 6.0%. Similarly, the statistical analysis conducted on geographies consisting of 532,951,359 people shows a moderate positive correlation between the proportion of Norwegians and percentage of population with ambulatory disability in the United States with a correlation coefficient (R) of 0.453 and weighted average of 5.9%, a difference of 1.3%.
Ambulatory Disability Correlation Summary
| Measurement | Immigrants from Zaire | Norwegian |
| Minimum | 2.5% | 1.3% |
| Maximum | 32.2% | 18.9% |
| Range | 29.6% | 17.7% |
| Mean | 6.9% | 6.8% |
| Median | 5.8% | 6.1% |
| Interquartile 25% (IQ1) | 5.0% | 5.5% |
| Interquartile 75% (IQ3) | 6.4% | 7.3% |
| Interquartile Range (IQR) | 1.4% | 1.7% |
| Standard Deviation (Sample) | 5.4% | 2.6% |
| Standard Deviation (Population) | 5.3% | 2.6% |
Demographics Similar to Immigrants from Zaire and Norwegians by Ambulatory Disability
In terms of ambulatory disability, the demographic groups most similar to Immigrants from Zaire are Immigrants from Hungary (6.0%, a difference of 0.030%), Immigrants from North Macedonia (6.0%, a difference of 0.050%), Immigrants from Syria (6.0%, a difference of 0.050%), Immigrants from Italy (6.0%, a difference of 0.14%), and Ute (6.0%, a difference of 0.32%). Similarly, the demographic groups most similar to Norwegians are Estonian (5.9%, a difference of 0.040%), Costa Rican (5.9%, a difference of 0.11%), Icelander (5.9%, a difference of 0.11%), Immigrants from Russia (5.9%, a difference of 0.13%), and Immigrants from Middle Africa (5.9%, a difference of 0.17%).
| Demographics | Rating | Rank | Ambulatory Disability |
| Norwegians | 93.1 /100 | #119 | Exceptional 5.9% |
| Estonians | 92.9 /100 | #120 | Exceptional 5.9% |
| Costa Ricans | 92.6 /100 | #121 | Exceptional 5.9% |
| Icelanders | 92.6 /100 | #122 | Exceptional 5.9% |
| Immigrants | Russia | 92.4 /100 | #123 | Exceptional 5.9% |
| Immigrants | Middle Africa | 92.2 /100 | #124 | Exceptional 5.9% |
| Koreans | 91.6 /100 | #125 | Exceptional 5.9% |
| Arabs | 91.5 /100 | #126 | Exceptional 5.9% |
| Immigrants | Nigeria | 90.9 /100 | #127 | Exceptional 5.9% |
| Immigrants | Western Asia | 90.7 /100 | #128 | Exceptional 5.9% |
| Immigrants | Norway | 90.5 /100 | #129 | Exceptional 5.9% |
| Immigrants | Kazakhstan | 89.7 /100 | #130 | Excellent 5.9% |
| Immigrants | Costa Rica | 89.5 /100 | #131 | Excellent 5.9% |
| Immigrants | Europe | 87.8 /100 | #132 | Excellent 6.0% |
| Immigrants | Immigrants | 86.9 /100 | #133 | Excellent 6.0% |
| Ute | 86.6 /100 | #134 | Excellent 6.0% |
| Immigrants | Italy | 85.0 /100 | #135 | Excellent 6.0% |
| Immigrants | North Macedonia | 84.1 /100 | #136 | Excellent 6.0% |
| Immigrants | Syria | 84.1 /100 | #137 | Excellent 6.0% |
| Immigrants | Hungary | 83.9 /100 | #138 | Excellent 6.0% |
| Immigrants | Zaire | 83.6 /100 | #139 | Excellent 6.0% |