Immigrants from Eastern Asia vs Spanish American Hearing Disability
COMPARE
Immigrants from Eastern Asia
Spanish American
Hearing Disability
Hearing Disability Comparison
Immigrants from Eastern Asia
Spanish Americans
2.7%
HEARING DISABILITY
99.0/ 100
METRIC RATING
53rd/ 347
METRIC RANK
4.0%
HEARING DISABILITY
0.0/ 100
METRIC RATING
316th/ 347
METRIC RANK
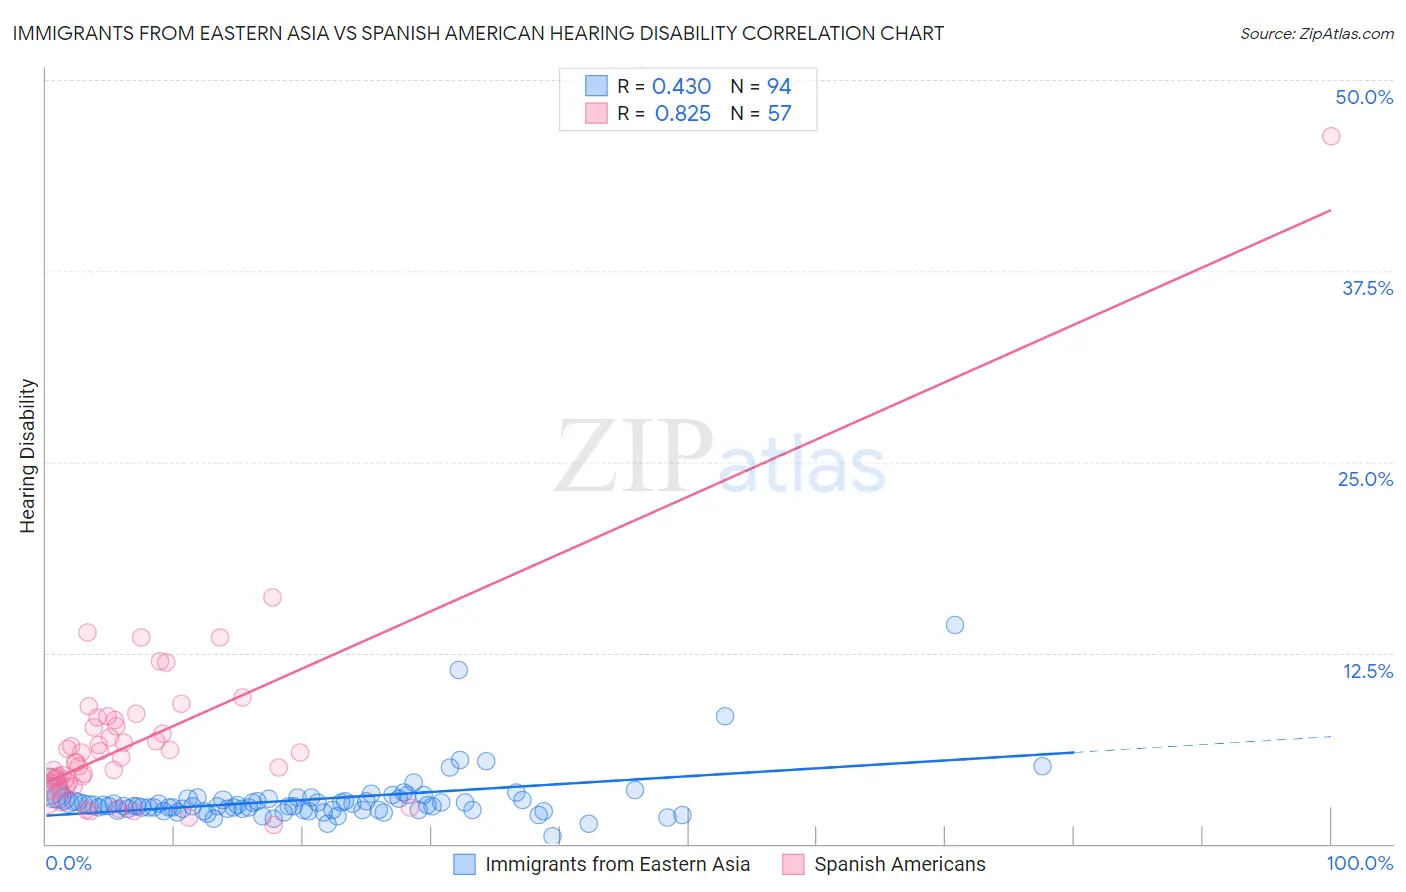
Immigrants from Eastern Asia vs Spanish American Hearing Disability Correlation Chart
The statistical analysis conducted on geographies consisting of 499,587,634 people shows a moderate positive correlation between the proportion of Immigrants from Eastern Asia and percentage of population with hearing disability in the United States with a correlation coefficient (R) of 0.430 and weighted average of 2.7%. Similarly, the statistical analysis conducted on geographies consisting of 103,164,367 people shows a very strong positive correlation between the proportion of Spanish Americans and percentage of population with hearing disability in the United States with a correlation coefficient (R) of 0.825 and weighted average of 4.0%, a difference of 48.1%.
Hearing Disability Correlation Summary
| Measurement | Immigrants from Eastern Asia | Spanish American |
| Minimum | 0.45% | 1.3% |
| Maximum | 14.3% | 46.3% |
| Range | 13.8% | 45.0% |
| Mean | 2.9% | 6.8% |
| Median | 2.5% | 5.4% |
| Interquartile 25% (IQ1) | 2.2% | 4.0% |
| Interquartile 75% (IQ3) | 2.9% | 7.9% |
| Interquartile Range (IQR) | 0.71% | 3.9% |
| Standard Deviation (Sample) | 1.8% | 6.3% |
| Standard Deviation (Population) | 1.8% | 6.2% |
Similar Demographics by Hearing Disability
Demographics Similar to Immigrants from Eastern Asia by Hearing Disability
In terms of hearing disability, the demographic groups most similar to Immigrants from Eastern Asia are Ethiopian (2.7%, a difference of 0.030%), Jamaican (2.7%, a difference of 0.070%), Immigrants from Ethiopia (2.7%, a difference of 0.10%), Immigrants from Nicaragua (2.7%, a difference of 0.12%), and South American (2.7%, a difference of 0.16%).
| Demographics | Rating | Rank | Hearing Disability |
| Immigrants | Dominica | 99.3 /100 | #46 | Exceptional 2.6% |
| Immigrants | Israel | 99.3 /100 | #47 | Exceptional 2.6% |
| Immigrants | Singapore | 99.3 /100 | #48 | Exceptional 2.6% |
| Immigrants | South America | 99.2 /100 | #49 | Exceptional 2.7% |
| Paraguayans | 99.2 /100 | #50 | Exceptional 2.7% |
| Immigrants | Hong Kong | 99.2 /100 | #51 | Exceptional 2.7% |
| Jamaicans | 99.0 /100 | #52 | Exceptional 2.7% |
| Immigrants | Eastern Asia | 99.0 /100 | #53 | Exceptional 2.7% |
| Ethiopians | 99.0 /100 | #54 | Exceptional 2.7% |
| Immigrants | Ethiopia | 99.0 /100 | #55 | Exceptional 2.7% |
| Immigrants | Nicaragua | 99.0 /100 | #56 | Exceptional 2.7% |
| South Americans | 99.0 /100 | #57 | Exceptional 2.7% |
| Immigrants | Peru | 98.6 /100 | #58 | Exceptional 2.7% |
| Immigrants | Eritrea | 98.5 /100 | #59 | Exceptional 2.7% |
| Immigrants | Egypt | 98.5 /100 | #60 | Exceptional 2.7% |
Demographics Similar to Spanish Americans by Hearing Disability
In terms of hearing disability, the demographic groups most similar to Spanish Americans are Comanche (4.0%, a difference of 0.13%), Puget Sound Salish (3.9%, a difference of 0.20%), Yakama (3.9%, a difference of 0.21%), Cheyenne (4.0%, a difference of 0.31%), and Hopi (3.9%, a difference of 0.38%).
| Demographics | Rating | Rank | Hearing Disability |
| Scotch-Irish | 0.0 /100 | #309 | Tragic 3.8% |
| Cree | 0.0 /100 | #310 | Tragic 3.8% |
| Americans | 0.0 /100 | #311 | Tragic 3.9% |
| Cajuns | 0.0 /100 | #312 | Tragic 3.9% |
| Hopi | 0.0 /100 | #313 | Tragic 3.9% |
| Yakama | 0.0 /100 | #314 | Tragic 3.9% |
| Puget Sound Salish | 0.0 /100 | #315 | Tragic 3.9% |
| Spanish Americans | 0.0 /100 | #316 | Tragic 4.0% |
| Comanche | 0.0 /100 | #317 | Tragic 4.0% |
| Cheyenne | 0.0 /100 | #318 | Tragic 4.0% |
| Chippewa | 0.0 /100 | #319 | Tragic 4.0% |
| Shoshone | 0.0 /100 | #320 | Tragic 4.0% |
| Paiute | 0.0 /100 | #321 | Tragic 4.1% |
| Seminole | 0.0 /100 | #322 | Tragic 4.1% |
| Apache | 0.0 /100 | #323 | Tragic 4.1% |