Immigrants from Eastern Asia vs Norwegian 9th Grade
COMPARE
Immigrants from Eastern Asia
Norwegian
9th Grade
9th Grade Comparison
Immigrants from Eastern Asia
Norwegians
94.6%
9TH GRADE
19.8/ 100
METRIC RATING
202nd/ 347
METRIC RANK
96.9%
9TH GRADE
100.0/ 100
METRIC RATING
2nd/ 347
METRIC RANK
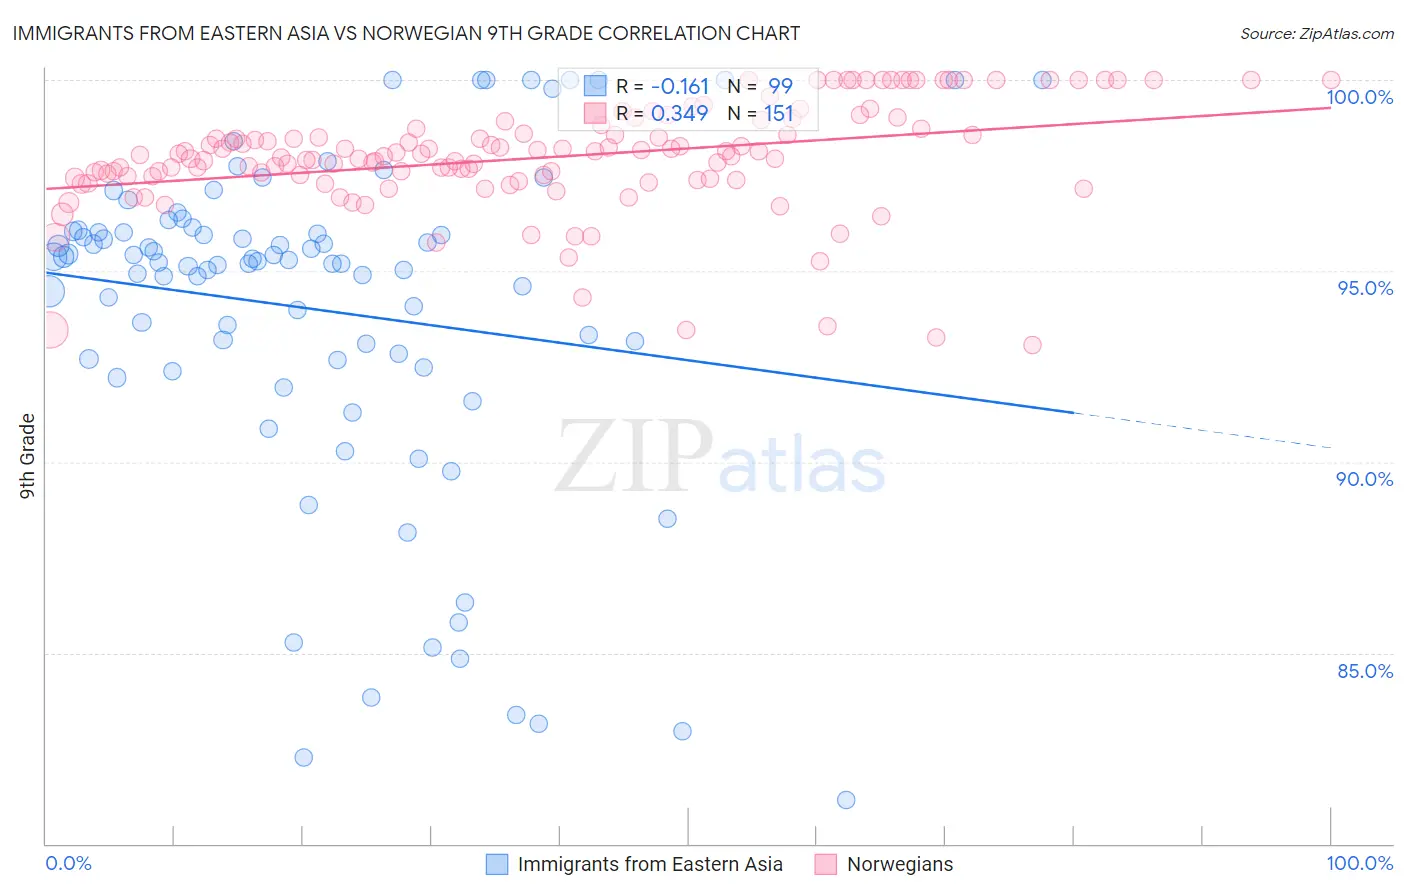
Immigrants from Eastern Asia vs Norwegian 9th Grade Correlation Chart
The statistical analysis conducted on geographies consisting of 499,846,352 people shows a poor negative correlation between the proportion of Immigrants from Eastern Asia and percentage of population with at least 9th grade education in the United States with a correlation coefficient (R) of -0.161 and weighted average of 94.6%. Similarly, the statistical analysis conducted on geographies consisting of 533,395,166 people shows a mild positive correlation between the proportion of Norwegians and percentage of population with at least 9th grade education in the United States with a correlation coefficient (R) of 0.349 and weighted average of 96.9%, a difference of 2.4%.
9th Grade Correlation Summary
| Measurement | Immigrants from Eastern Asia | Norwegian |
| Minimum | 81.1% | 93.1% |
| Maximum | 100.0% | 100.0% |
| Range | 18.9% | 6.9% |
| Mean | 94.0% | 98.0% |
| Median | 95.2% | 98.0% |
| Interquartile 25% (IQ1) | 92.7% | 97.4% |
| Interquartile 75% (IQ3) | 96.0% | 98.7% |
| Interquartile Range (IQR) | 3.4% | 1.3% |
| Standard Deviation (Sample) | 4.4% | 1.4% |
| Standard Deviation (Population) | 4.4% | 1.4% |
Similar Demographics by 9th Grade
Demographics Similar to Immigrants from Eastern Asia by 9th Grade
In terms of 9th grade, the demographic groups most similar to Immigrants from Eastern Asia are Immigrants from Bahamas (94.6%, a difference of 0.0%), Moroccan (94.6%, a difference of 0.0%), Laotian (94.6%, a difference of 0.010%), Immigrants from Zaire (94.6%, a difference of 0.010%), and Black/African American (94.6%, a difference of 0.010%).
| Demographics | Rating | Rank | 9th Grade |
| Marshallese | 27.9 /100 | #195 | Fair 94.7% |
| Immigrants | Lebanon | 27.2 /100 | #196 | Fair 94.7% |
| Immigrants | Micronesia | 24.7 /100 | #197 | Fair 94.7% |
| Hawaiians | 22.7 /100 | #198 | Fair 94.7% |
| Laotians | 21.0 /100 | #199 | Fair 94.6% |
| Immigrants | Zaire | 20.6 /100 | #200 | Fair 94.6% |
| Blacks/African Americans | 20.5 /100 | #201 | Fair 94.6% |
| Immigrants | Eastern Asia | 19.8 /100 | #202 | Poor 94.6% |
| Immigrants | Bahamas | 19.8 /100 | #203 | Poor 94.6% |
| Moroccans | 19.6 /100 | #204 | Poor 94.6% |
| Immigrants | Sudan | 17.6 /100 | #205 | Poor 94.6% |
| Samoans | 17.3 /100 | #206 | Poor 94.6% |
| Immigrants | Morocco | 16.3 /100 | #207 | Poor 94.6% |
| Immigrants | Pakistan | 15.5 /100 | #208 | Poor 94.6% |
| Comanche | 14.9 /100 | #209 | Poor 94.6% |
Demographics Similar to Norwegians by 9th Grade
In terms of 9th grade, the demographic groups most similar to Norwegians are Slovak (96.9%, a difference of 0.050%), Tsimshian (97.0%, a difference of 0.090%), Slovene (96.7%, a difference of 0.18%), Swedish (96.7%, a difference of 0.18%), and Polish (96.7%, a difference of 0.19%).
| Demographics | Rating | Rank | 9th Grade |
| Tsimshian | 100.0 /100 | #1 | Exceptional 97.0% |
| Norwegians | 100.0 /100 | #2 | Exceptional 96.9% |
| Slovaks | 100.0 /100 | #3 | Exceptional 96.9% |
| Slovenes | 100.0 /100 | #4 | Exceptional 96.7% |
| Swedes | 100.0 /100 | #5 | Exceptional 96.7% |
| Poles | 100.0 /100 | #6 | Exceptional 96.7% |
| Carpatho Rusyns | 100.0 /100 | #7 | Exceptional 96.7% |
| Germans | 100.0 /100 | #8 | Exceptional 96.7% |
| Tlingit-Haida | 100.0 /100 | #9 | Exceptional 96.6% |
| Lithuanians | 100.0 /100 | #10 | Exceptional 96.6% |
| Finns | 100.0 /100 | #11 | Exceptional 96.6% |
| English | 100.0 /100 | #12 | Exceptional 96.6% |
| Danes | 100.0 /100 | #13 | Exceptional 96.5% |
| Scottish | 100.0 /100 | #14 | Exceptional 96.5% |
| Irish | 100.0 /100 | #15 | Exceptional 96.5% |