Immigrants from Eritrea vs Norwegian Disability Age Under 5
COMPARE
Immigrants from Eritrea
Norwegian
Disability Age Under 5
Disability Age Under 5 Comparison
Immigrants from Eritrea
Norwegians
1.2%
DISABILITY AGE UNDER 5
92.3/ 100
METRIC RATING
120th/ 347
METRIC RANK
1.7%
DISABILITY AGE UNDER 5
0.0/ 100
METRIC RATING
314th/ 347
METRIC RANK
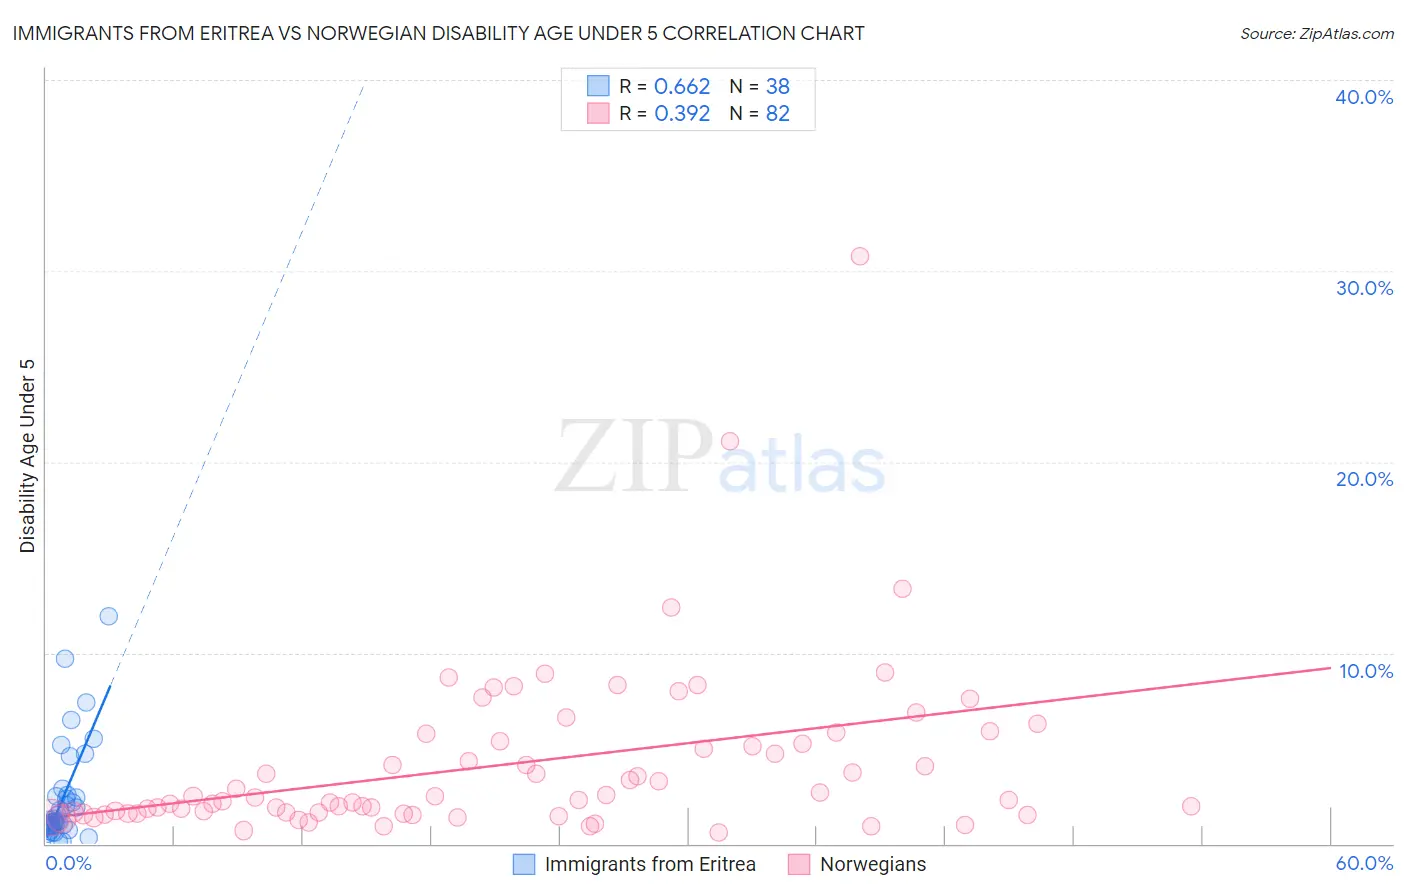
Immigrants from Eritrea vs Norwegian Disability Age Under 5 Correlation Chart
The statistical analysis conducted on geographies consisting of 83,045,711 people shows a significant positive correlation between the proportion of Immigrants from Eritrea and percentage of population with a disability under the age of 5 in the United States with a correlation coefficient (R) of 0.662 and weighted average of 1.2%. Similarly, the statistical analysis conducted on geographies consisting of 251,234,547 people shows a mild positive correlation between the proportion of Norwegians and percentage of population with a disability under the age of 5 in the United States with a correlation coefficient (R) of 0.392 and weighted average of 1.7%, a difference of 43.2%.
Disability Age Under 5 Correlation Summary
| Measurement | Immigrants from Eritrea | Norwegian |
| Minimum | 0.12% | 0.60% |
| Maximum | 11.9% | 30.8% |
| Range | 11.8% | 30.2% |
| Mean | 2.5% | 4.2% |
| Median | 1.3% | 2.4% |
| Interquartile 25% (IQ1) | 0.90% | 1.6% |
| Interquartile 75% (IQ3) | 2.5% | 5.4% |
| Interquartile Range (IQR) | 1.6% | 3.8% |
| Standard Deviation (Sample) | 2.7% | 4.5% |
| Standard Deviation (Population) | 2.6% | 4.5% |
Similar Demographics by Disability Age Under 5
Demographics Similar to Immigrants from Eritrea by Disability Age Under 5
In terms of disability age under 5, the demographic groups most similar to Immigrants from Eritrea are Bhutanese (1.2%, a difference of 0.070%), Immigrants from Senegal (1.2%, a difference of 0.28%), Immigrants from Venezuela (1.2%, a difference of 0.41%), Immigrants from Philippines (1.2%, a difference of 0.44%), and Aleut (1.2%, a difference of 0.47%).
| Demographics | Rating | Rank | Disability Age Under 5 |
| Immigrants | Oceania | 94.2 /100 | #113 | Exceptional 1.2% |
| Belizeans | 93.9 /100 | #114 | Exceptional 1.2% |
| Immigrants | Caribbean | 93.8 /100 | #115 | Exceptional 1.2% |
| Immigrants | Northern Africa | 93.8 /100 | #116 | Exceptional 1.2% |
| Immigrants | Philippines | 93.5 /100 | #117 | Exceptional 1.2% |
| Immigrants | Venezuela | 93.4 /100 | #118 | Exceptional 1.2% |
| Bhutanese | 92.5 /100 | #119 | Exceptional 1.2% |
| Immigrants | Eritrea | 92.3 /100 | #120 | Exceptional 1.2% |
| Immigrants | Senegal | 91.4 /100 | #121 | Exceptional 1.2% |
| Aleuts | 90.7 /100 | #122 | Exceptional 1.2% |
| Zimbabweans | 90.6 /100 | #123 | Exceptional 1.2% |
| Immigrants | Cambodia | 90.5 /100 | #124 | Exceptional 1.2% |
| Japanese | 90.3 /100 | #125 | Exceptional 1.2% |
| Central Americans | 89.7 /100 | #126 | Excellent 1.2% |
| Immigrants | Romania | 88.4 /100 | #127 | Excellent 1.2% |
Demographics Similar to Norwegians by Disability Age Under 5
In terms of disability age under 5, the demographic groups most similar to Norwegians are Celtic (1.7%, a difference of 0.16%), Dutch (1.7%, a difference of 0.26%), Puerto Rican (1.7%, a difference of 0.32%), English (1.7%, a difference of 0.36%), and Immigrants from Cabo Verde (1.7%, a difference of 0.44%).
| Demographics | Rating | Rank | Disability Age Under 5 |
| Scottish | 0.0 /100 | #307 | Tragic 1.6% |
| Navajo | 0.0 /100 | #308 | Tragic 1.6% |
| Cape Verdeans | 0.0 /100 | #309 | Tragic 1.7% |
| Whites/Caucasians | 0.0 /100 | #310 | Tragic 1.7% |
| English | 0.0 /100 | #311 | Tragic 1.7% |
| Puerto Ricans | 0.0 /100 | #312 | Tragic 1.7% |
| Celtics | 0.0 /100 | #313 | Tragic 1.7% |
| Norwegians | 0.0 /100 | #314 | Tragic 1.7% |
| Dutch | 0.0 /100 | #315 | Tragic 1.7% |
| Immigrants | Cabo Verde | 0.0 /100 | #316 | Tragic 1.7% |
| French | 0.0 /100 | #317 | Tragic 1.7% |
| Irish | 0.0 /100 | #318 | Tragic 1.7% |
| Slovaks | 0.0 /100 | #319 | Tragic 1.7% |
| Scotch-Irish | 0.0 /100 | #320 | Tragic 1.7% |
| Ottawa | 0.0 /100 | #321 | Tragic 1.7% |