Puerto Rican vs Immigrants from Africa Disability
COMPARE
Puerto Rican
Immigrants from Africa
Disability
Disability Comparison
Puerto Ricans
Immigrants from Africa
16.1%
DISABILITY
0.0/ 100
METRIC RATING
345th/ 347
METRIC RANK
11.4%
DISABILITY
89.3/ 100
METRIC RATING
132nd/ 347
METRIC RANK
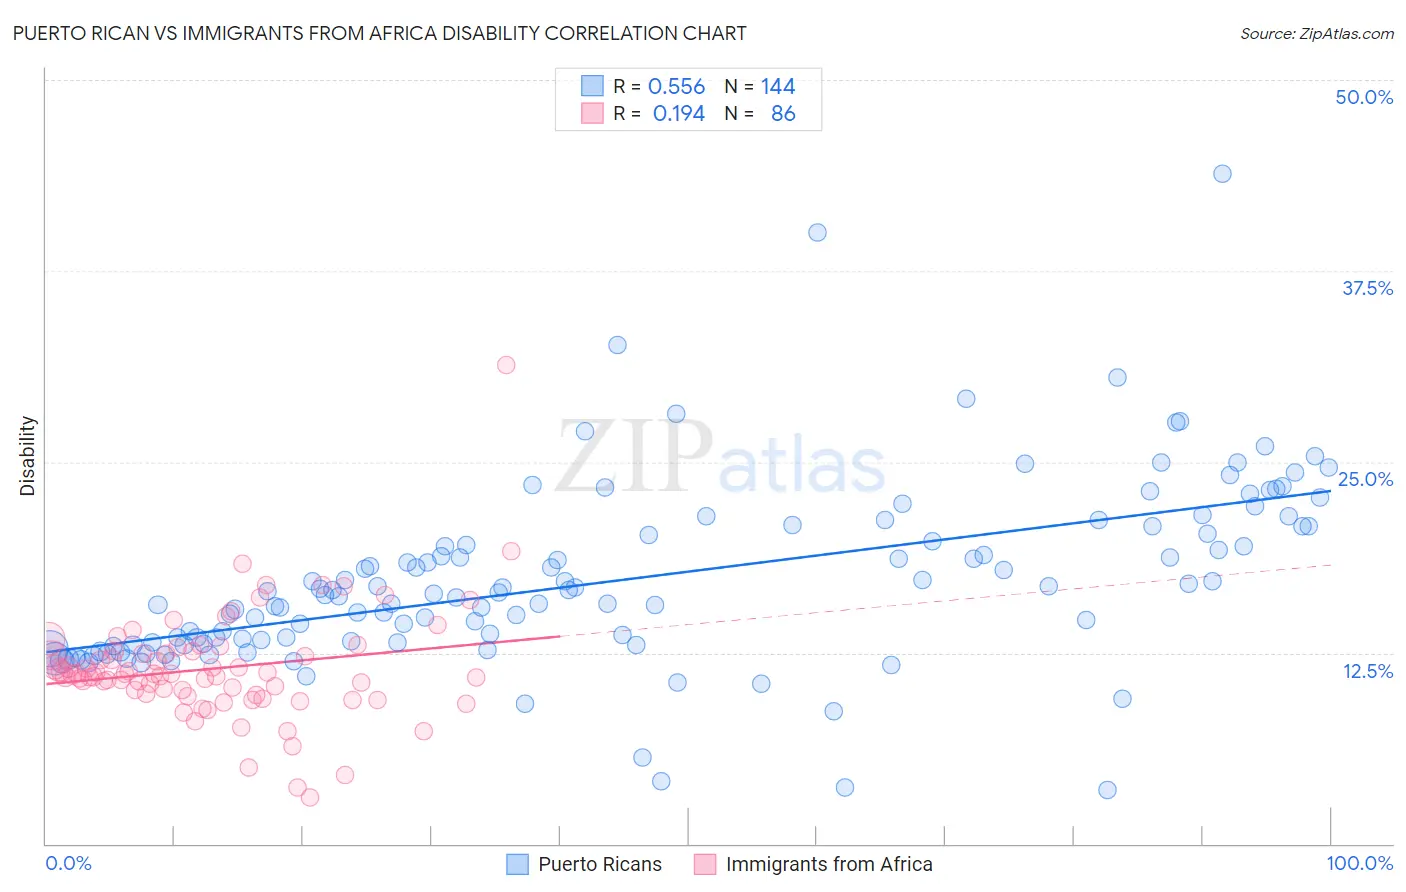
Puerto Rican vs Immigrants from Africa Disability Correlation Chart
The statistical analysis conducted on geographies consisting of 528,171,065 people shows a substantial positive correlation between the proportion of Puerto Ricans and percentage of population with a disability in the United States with a correlation coefficient (R) of 0.556 and weighted average of 16.1%. Similarly, the statistical analysis conducted on geographies consisting of 469,357,699 people shows a poor positive correlation between the proportion of Immigrants from Africa and percentage of population with a disability in the United States with a correlation coefficient (R) of 0.194 and weighted average of 11.4%, a difference of 41.0%.
Disability Correlation Summary
| Measurement | Puerto Rican | Immigrants from Africa |
| Minimum | 3.6% | 3.0% |
| Maximum | 43.9% | 31.3% |
| Range | 40.3% | 28.3% |
| Mean | 17.2% | 11.5% |
| Median | 16.4% | 11.1% |
| Interquartile 25% (IQ1) | 13.2% | 9.8% |
| Interquartile 75% (IQ3) | 20.5% | 12.6% |
| Interquartile Range (IQR) | 7.4% | 2.8% |
| Standard Deviation (Sample) | 6.0% | 3.6% |
| Standard Deviation (Population) | 6.0% | 3.6% |
Similar Demographics by Disability
Demographics Similar to Puerto Ricans by Disability
In terms of disability, the demographic groups most similar to Puerto Ricans are Tsimshian (16.1%, a difference of 0.16%), Colville (15.8%, a difference of 2.0%), Creek (15.6%, a difference of 3.3%), Kiowa (15.6%, a difference of 3.3%), and Lumbee (15.5%, a difference of 3.8%).
| Demographics | Rating | Rank | Disability |
| Cajuns | 0.0 /100 | #333 | Tragic 14.6% |
| Yuman | 0.0 /100 | #334 | Tragic 14.6% |
| Tohono O'odham | 0.0 /100 | #335 | Tragic 14.8% |
| Cherokee | 0.0 /100 | #336 | Tragic 14.8% |
| Seminole | 0.0 /100 | #337 | Tragic 14.9% |
| Dutch West Indians | 0.0 /100 | #338 | Tragic 14.9% |
| Chickasaw | 0.0 /100 | #339 | Tragic 15.2% |
| Choctaw | 0.0 /100 | #340 | Tragic 15.4% |
| Lumbee | 0.0 /100 | #341 | Tragic 15.5% |
| Kiowa | 0.0 /100 | #342 | Tragic 15.6% |
| Creek | 0.0 /100 | #343 | Tragic 15.6% |
| Colville | 0.0 /100 | #344 | Tragic 15.8% |
| Puerto Ricans | 0.0 /100 | #345 | Tragic 16.1% |
| Tsimshian | 0.0 /100 | #346 | Tragic 16.1% |
| Houma | 0.0 /100 | #347 | Tragic 17.1% |
Demographics Similar to Immigrants from Africa by Disability
In terms of disability, the demographic groups most similar to Immigrants from Africa are Arab (11.4%, a difference of 0.030%), Immigrants from Croatia (11.4%, a difference of 0.060%), Latvian (11.4%, a difference of 0.070%), Immigrants from Guyana (11.4%, a difference of 0.11%), and Macedonian (11.4%, a difference of 0.12%).
| Demographics | Rating | Rank | Disability |
| Costa Ricans | 91.9 /100 | #125 | Exceptional 11.4% |
| Immigrants | Latvia | 90.9 /100 | #126 | Exceptional 11.4% |
| Immigrants | Italy | 90.4 /100 | #127 | Exceptional 11.4% |
| Immigrants | Europe | 90.4 /100 | #128 | Exceptional 11.4% |
| Macedonians | 90.3 /100 | #129 | Exceptional 11.4% |
| Latvians | 89.8 /100 | #130 | Excellent 11.4% |
| Immigrants | Croatia | 89.8 /100 | #131 | Excellent 11.4% |
| Immigrants | Africa | 89.3 /100 | #132 | Excellent 11.4% |
| Arabs | 89.1 /100 | #133 | Excellent 11.4% |
| Immigrants | Guyana | 88.3 /100 | #134 | Excellent 11.4% |
| Ugandans | 87.9 /100 | #135 | Excellent 11.4% |
| Immigrants | St. Vincent and the Grenadines | 87.8 /100 | #136 | Excellent 11.4% |
| Kenyans | 87.1 /100 | #137 | Excellent 11.5% |
| New Zealanders | 87.0 /100 | #138 | Excellent 11.5% |
| Ghanaians | 87.0 /100 | #139 | Excellent 11.5% |