Immigrants from Dominican Republic vs Creek Female Disability
COMPARE
Immigrants from Dominican Republic
Creek
Female Disability
Female Disability Comparison
Immigrants from Dominican Republic
Creek
13.4%
FEMALE DISABILITY
0.0/ 100
METRIC RATING
299th/ 347
METRIC RANK
15.7%
FEMALE DISABILITY
0.0/ 100
METRIC RATING
342nd/ 347
METRIC RANK
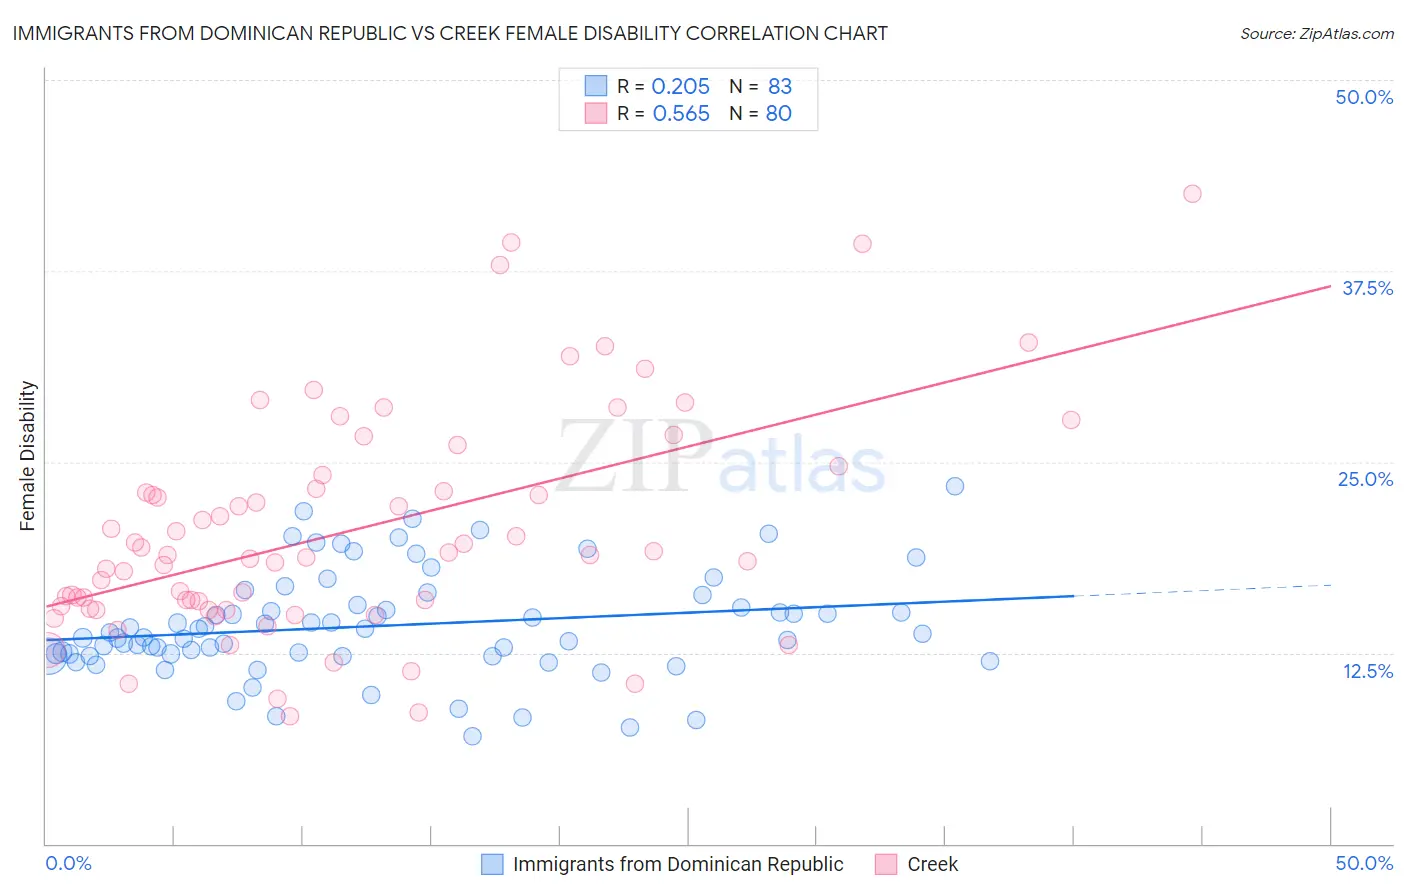
Immigrants from Dominican Republic vs Creek Female Disability Correlation Chart
The statistical analysis conducted on geographies consisting of 275,087,890 people shows a weak positive correlation between the proportion of Immigrants from Dominican Republic and percentage of females with a disability in the United States with a correlation coefficient (R) of 0.205 and weighted average of 13.4%. Similarly, the statistical analysis conducted on geographies consisting of 178,448,690 people shows a substantial positive correlation between the proportion of Creek and percentage of females with a disability in the United States with a correlation coefficient (R) of 0.565 and weighted average of 15.7%, a difference of 16.9%.
Female Disability Correlation Summary
| Measurement | Immigrants from Dominican Republic | Creek |
| Minimum | 7.0% | 8.3% |
| Maximum | 23.4% | 42.6% |
| Range | 16.4% | 34.2% |
| Mean | 14.3% | 20.5% |
| Median | 13.7% | 18.9% |
| Interquartile 25% (IQ1) | 12.3% | 15.4% |
| Interquartile 75% (IQ3) | 15.6% | 23.7% |
| Interquartile Range (IQR) | 3.3% | 8.2% |
| Standard Deviation (Sample) | 3.4% | 7.3% |
| Standard Deviation (Population) | 3.4% | 7.3% |
Similar Demographics by Female Disability
Demographics Similar to Immigrants from Dominican Republic by Female Disability
In terms of female disability, the demographic groups most similar to Immigrants from Dominican Republic are Pennsylvania German (13.4%, a difference of 0.010%), African (13.4%, a difference of 0.21%), Nonimmigrants (13.4%, a difference of 0.26%), Scotch-Irish (13.4%, a difference of 0.35%), and Immigrants from Portugal (13.5%, a difference of 0.35%).
| Demographics | Rating | Rank | Female Disability |
| Yakama | 0.0 /100 | #292 | Tragic 13.2% |
| Marshallese | 0.0 /100 | #293 | Tragic 13.3% |
| Celtics | 0.0 /100 | #294 | Tragic 13.3% |
| French | 0.0 /100 | #295 | Tragic 13.3% |
| Nepalese | 0.0 /100 | #296 | Tragic 13.3% |
| Slovaks | 0.0 /100 | #297 | Tragic 13.3% |
| Immigrants | Nonimmigrants | 0.0 /100 | #298 | Tragic 13.4% |
| Immigrants | Dominican Republic | 0.0 /100 | #299 | Tragic 13.4% |
| Pennsylvania Germans | 0.0 /100 | #300 | Tragic 13.4% |
| Africans | 0.0 /100 | #301 | Tragic 13.4% |
| Scotch-Irish | 0.0 /100 | #302 | Tragic 13.4% |
| Immigrants | Portugal | 0.0 /100 | #303 | Tragic 13.5% |
| Immigrants | Micronesia | 0.0 /100 | #304 | Tragic 13.5% |
| Dominicans | 0.0 /100 | #305 | Tragic 13.5% |
| French Canadians | 0.0 /100 | #306 | Tragic 13.6% |
Demographics Similar to Creek by Female Disability
In terms of female disability, the demographic groups most similar to Creek are Lumbee (15.8%, a difference of 0.68%), Kiowa (15.8%, a difference of 0.84%), Choctaw (15.4%, a difference of 1.6%), Chickasaw (15.2%, a difference of 3.0%), and Colville (15.1%, a difference of 4.0%).
| Demographics | Rating | Rank | Female Disability |
| Immigrants | Azores | 0.0 /100 | #333 | Tragic 14.9% |
| Cherokee | 0.0 /100 | #334 | Tragic 14.9% |
| Cajuns | 0.0 /100 | #335 | Tragic 14.9% |
| Seminole | 0.0 /100 | #336 | Tragic 15.0% |
| Tohono O'odham | 0.0 /100 | #337 | Tragic 15.0% |
| Dutch West Indians | 0.0 /100 | #338 | Tragic 15.0% |
| Colville | 0.0 /100 | #339 | Tragic 15.1% |
| Chickasaw | 0.0 /100 | #340 | Tragic 15.2% |
| Choctaw | 0.0 /100 | #341 | Tragic 15.4% |
| Creek | 0.0 /100 | #342 | Tragic 15.7% |
| Lumbee | 0.0 /100 | #343 | Tragic 15.8% |
| Kiowa | 0.0 /100 | #344 | Tragic 15.8% |
| Puerto Ricans | 0.0 /100 | #345 | Tragic 16.6% |
| Tsimshian | 0.0 /100 | #346 | Tragic 16.8% |
| Houma | 0.0 /100 | #347 | Tragic 16.9% |