Immigrants from Dominican Republic vs Hmong Female Disability
COMPARE
Immigrants from Dominican Republic
Hmong
Female Disability
Female Disability Comparison
Immigrants from Dominican Republic
Hmong
13.4%
FEMALE DISABILITY
0.0/ 100
METRIC RATING
299th/ 347
METRIC RANK
13.1%
FEMALE DISABILITY
0.0/ 100
METRIC RATING
284th/ 347
METRIC RANK
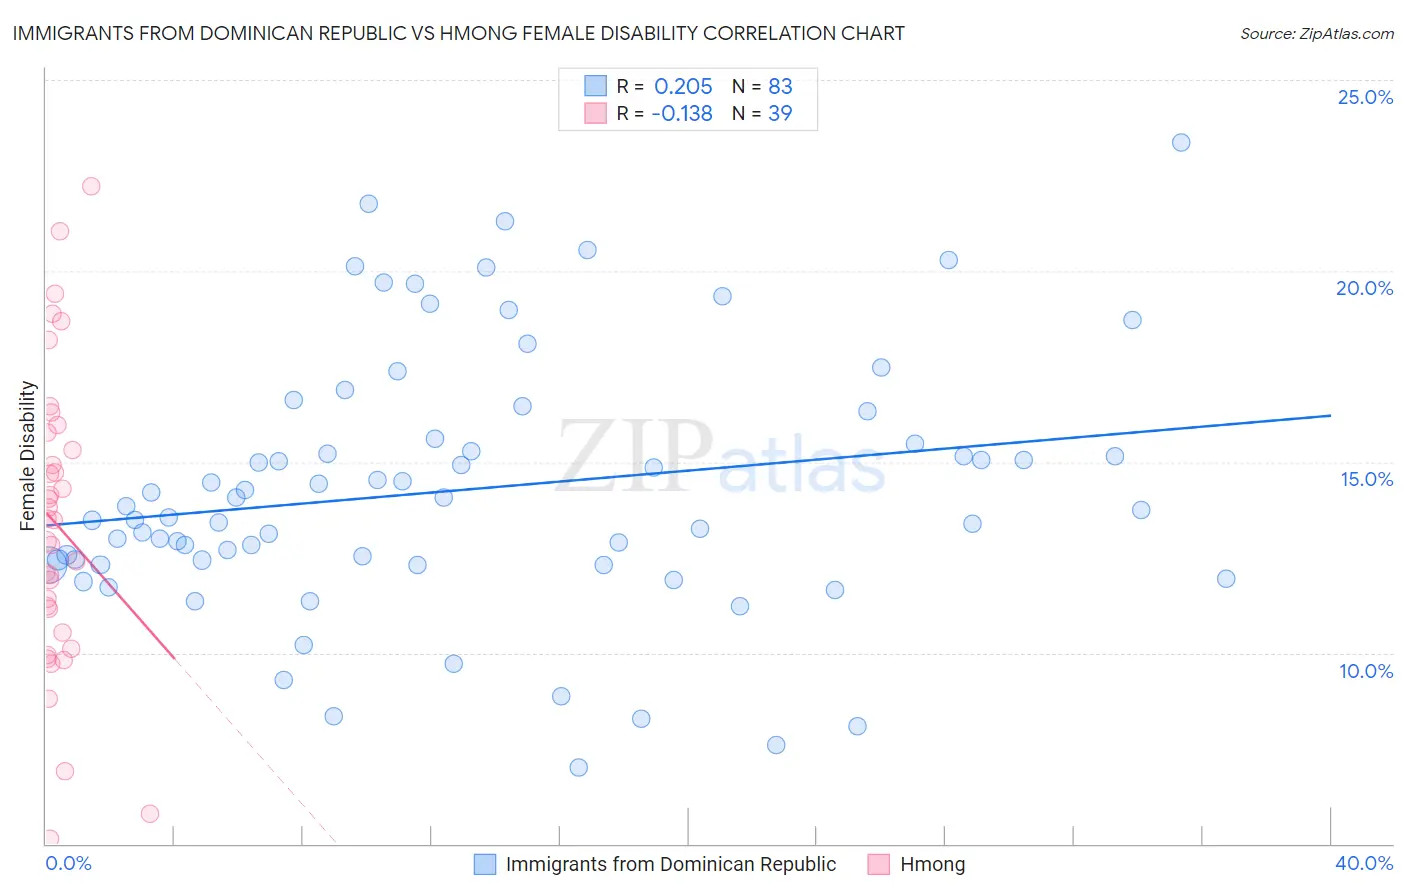
Immigrants from Dominican Republic vs Hmong Female Disability Correlation Chart
The statistical analysis conducted on geographies consisting of 275,087,890 people shows a weak positive correlation between the proportion of Immigrants from Dominican Republic and percentage of females with a disability in the United States with a correlation coefficient (R) of 0.205 and weighted average of 13.4%. Similarly, the statistical analysis conducted on geographies consisting of 24,681,034 people shows a poor negative correlation between the proportion of Hmong and percentage of females with a disability in the United States with a correlation coefficient (R) of -0.138 and weighted average of 13.1%, a difference of 2.4%.
Female Disability Correlation Summary
| Measurement | Immigrants from Dominican Republic | Hmong |
| Minimum | 7.0% | 5.1% |
| Maximum | 23.4% | 22.2% |
| Range | 16.4% | 17.1% |
| Mean | 14.3% | 13.3% |
| Median | 13.7% | 13.5% |
| Interquartile 25% (IQ1) | 12.3% | 10.5% |
| Interquartile 75% (IQ3) | 15.6% | 15.8% |
| Interquartile Range (IQR) | 3.3% | 5.2% |
| Standard Deviation (Sample) | 3.4% | 3.9% |
| Standard Deviation (Population) | 3.4% | 3.8% |
Demographics Similar to Immigrants from Dominican Republic and Hmong by Female Disability
In terms of female disability, the demographic groups most similar to Immigrants from Dominican Republic are Pennsylvania German (13.4%, a difference of 0.010%), African (13.4%, a difference of 0.21%), Nonimmigrants (13.4%, a difference of 0.26%), Slovak (13.3%, a difference of 0.56%), and Nepalese (13.3%, a difference of 0.59%). Similarly, the demographic groups most similar to Hmong are Bangladeshi (13.1%, a difference of 0.050%), Fijian (13.1%, a difference of 0.10%), English (13.1%, a difference of 0.13%), Welsh (13.1%, a difference of 0.14%), and U.S. Virgin Islander (13.1%, a difference of 0.22%).
| Demographics | Rating | Rank | Female Disability |
| U.S. Virgin Islanders | 0.1 /100 | #281 | Tragic 13.1% |
| Welsh | 0.0 /100 | #282 | Tragic 13.1% |
| English | 0.0 /100 | #283 | Tragic 13.1% |
| Hmong | 0.0 /100 | #284 | Tragic 13.1% |
| Bangladeshis | 0.0 /100 | #285 | Tragic 13.1% |
| Fijians | 0.0 /100 | #286 | Tragic 13.1% |
| Yaqui | 0.0 /100 | #287 | Tragic 13.2% |
| Whites/Caucasians | 0.0 /100 | #288 | Tragic 13.2% |
| Tlingit-Haida | 0.0 /100 | #289 | Tragic 13.2% |
| Immigrants | Yemen | 0.0 /100 | #290 | Tragic 13.2% |
| Shoshone | 0.0 /100 | #291 | Tragic 13.2% |
| Yakama | 0.0 /100 | #292 | Tragic 13.2% |
| Marshallese | 0.0 /100 | #293 | Tragic 13.3% |
| Celtics | 0.0 /100 | #294 | Tragic 13.3% |
| French | 0.0 /100 | #295 | Tragic 13.3% |
| Nepalese | 0.0 /100 | #296 | Tragic 13.3% |
| Slovaks | 0.0 /100 | #297 | Tragic 13.3% |
| Immigrants | Nonimmigrants | 0.0 /100 | #298 | Tragic 13.4% |
| Immigrants | Dominican Republic | 0.0 /100 | #299 | Tragic 13.4% |
| Pennsylvania Germans | 0.0 /100 | #300 | Tragic 13.4% |
| Africans | 0.0 /100 | #301 | Tragic 13.4% |