Arab vs Creek Female Disability
COMPARE
Arab
Creek
Female Disability
Female Disability Comparison
Arabs
Creek
11.9%
FEMALE DISABILITY
95.1/ 100
METRIC RATING
131st/ 347
METRIC RANK
15.7%
FEMALE DISABILITY
0.0/ 100
METRIC RATING
342nd/ 347
METRIC RANK
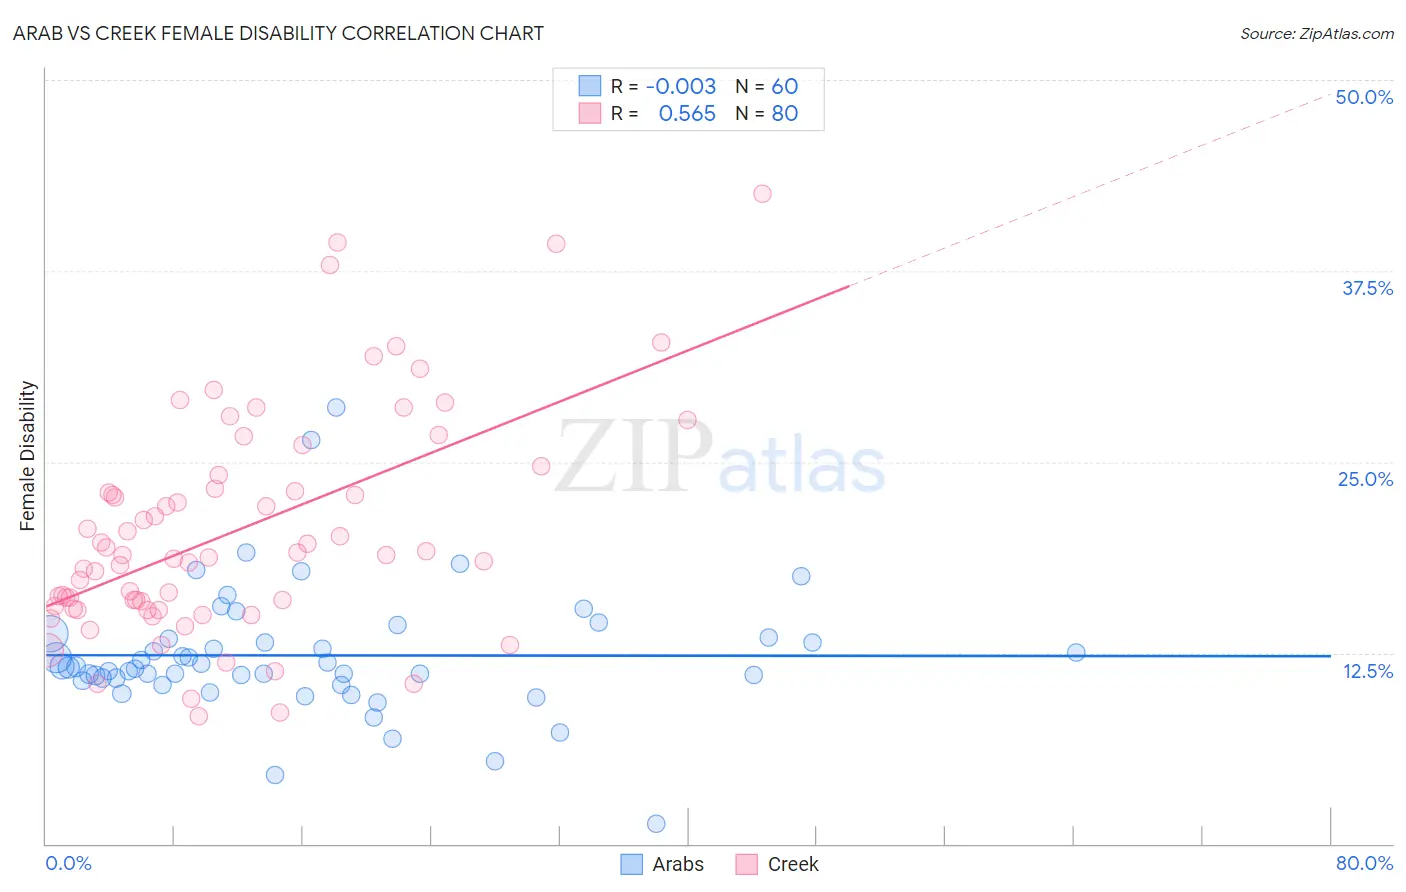
Arab vs Creek Female Disability Correlation Chart
The statistical analysis conducted on geographies consisting of 486,755,725 people shows no correlation between the proportion of Arabs and percentage of females with a disability in the United States with a correlation coefficient (R) of -0.003 and weighted average of 11.9%. Similarly, the statistical analysis conducted on geographies consisting of 178,448,690 people shows a substantial positive correlation between the proportion of Creek and percentage of females with a disability in the United States with a correlation coefficient (R) of 0.565 and weighted average of 15.7%, a difference of 32.1%.
Female Disability Correlation Summary
| Measurement | Arab | Creek |
| Minimum | 1.3% | 8.3% |
| Maximum | 28.6% | 42.6% |
| Range | 27.3% | 34.2% |
| Mean | 12.3% | 20.5% |
| Median | 11.5% | 18.9% |
| Interquartile 25% (IQ1) | 10.8% | 15.4% |
| Interquartile 75% (IQ3) | 13.4% | 23.7% |
| Interquartile Range (IQR) | 2.7% | 8.2% |
| Standard Deviation (Sample) | 4.3% | 7.3% |
| Standard Deviation (Population) | 4.2% | 7.3% |
Similar Demographics by Female Disability
Demographics Similar to Arabs by Female Disability
In terms of female disability, the demographic groups most similar to Arabs are Nicaraguan (11.9%, a difference of 0.030%), Macedonian (11.8%, a difference of 0.090%), Immigrants from Syria (11.9%, a difference of 0.10%), Kenyan (11.9%, a difference of 0.11%), and Immigrants from Nicaragua (11.9%, a difference of 0.11%).
| Demographics | Rating | Rank | Female Disability |
| Russians | 96.5 /100 | #124 | Exceptional 11.8% |
| Immigrants | Italy | 96.4 /100 | #125 | Exceptional 11.8% |
| Immigrants | Europe | 96.2 /100 | #126 | Exceptional 11.8% |
| South American Indians | 95.8 /100 | #127 | Exceptional 11.8% |
| Immigrants | Latvia | 95.6 /100 | #128 | Exceptional 11.8% |
| Macedonians | 95.5 /100 | #129 | Exceptional 11.8% |
| Nicaraguans | 95.2 /100 | #130 | Exceptional 11.9% |
| Arabs | 95.1 /100 | #131 | Exceptional 11.9% |
| Immigrants | Syria | 94.6 /100 | #132 | Exceptional 11.9% |
| Kenyans | 94.5 /100 | #133 | Exceptional 11.9% |
| Immigrants | Nicaragua | 94.5 /100 | #134 | Exceptional 11.9% |
| Central Americans | 94.2 /100 | #135 | Exceptional 11.9% |
| Ugandans | 94.0 /100 | #136 | Exceptional 11.9% |
| Immigrants | Norway | 93.8 /100 | #137 | Exceptional 11.9% |
| Ecuadorians | 93.4 /100 | #138 | Exceptional 11.9% |
Demographics Similar to Creek by Female Disability
In terms of female disability, the demographic groups most similar to Creek are Lumbee (15.8%, a difference of 0.68%), Kiowa (15.8%, a difference of 0.84%), Choctaw (15.4%, a difference of 1.6%), Chickasaw (15.2%, a difference of 3.0%), and Colville (15.1%, a difference of 4.0%).
| Demographics | Rating | Rank | Female Disability |
| Immigrants | Azores | 0.0 /100 | #333 | Tragic 14.9% |
| Cherokee | 0.0 /100 | #334 | Tragic 14.9% |
| Cajuns | 0.0 /100 | #335 | Tragic 14.9% |
| Seminole | 0.0 /100 | #336 | Tragic 15.0% |
| Tohono O'odham | 0.0 /100 | #337 | Tragic 15.0% |
| Dutch West Indians | 0.0 /100 | #338 | Tragic 15.0% |
| Colville | 0.0 /100 | #339 | Tragic 15.1% |
| Chickasaw | 0.0 /100 | #340 | Tragic 15.2% |
| Choctaw | 0.0 /100 | #341 | Tragic 15.4% |
| Creek | 0.0 /100 | #342 | Tragic 15.7% |
| Lumbee | 0.0 /100 | #343 | Tragic 15.8% |
| Kiowa | 0.0 /100 | #344 | Tragic 15.8% |
| Puerto Ricans | 0.0 /100 | #345 | Tragic 16.6% |
| Tsimshian | 0.0 /100 | #346 | Tragic 16.8% |
| Houma | 0.0 /100 | #347 | Tragic 16.9% |