Immigrants from Dominica vs Immigrants from Uzbekistan Hearing Disability
COMPARE
Immigrants from Dominica
Immigrants from Uzbekistan
Hearing Disability
Hearing Disability Comparison
Immigrants from Dominica
Immigrants from Uzbekistan
2.6%
HEARING DISABILITY
99.3/ 100
METRIC RATING
46th/ 347
METRIC RANK
2.7%
HEARING DISABILITY
98.4/ 100
METRIC RATING
61st/ 347
METRIC RANK
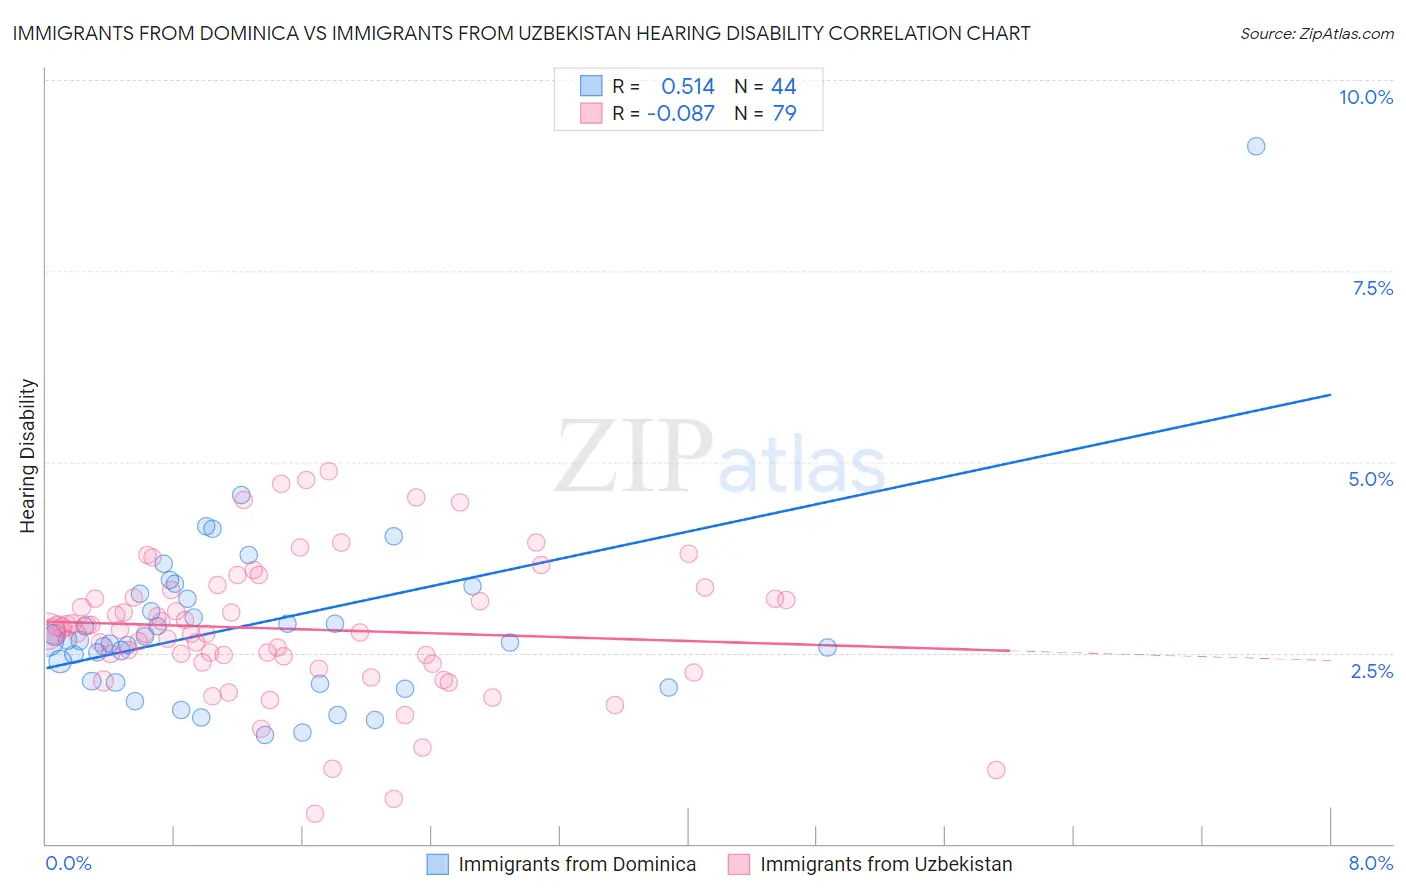
Immigrants from Dominica vs Immigrants from Uzbekistan Hearing Disability Correlation Chart
The statistical analysis conducted on geographies consisting of 83,776,076 people shows a substantial positive correlation between the proportion of Immigrants from Dominica and percentage of population with hearing disability in the United States with a correlation coefficient (R) of 0.514 and weighted average of 2.6%. Similarly, the statistical analysis conducted on geographies consisting of 118,732,772 people shows a slight negative correlation between the proportion of Immigrants from Uzbekistan and percentage of population with hearing disability in the United States with a correlation coefficient (R) of -0.087 and weighted average of 2.7%, a difference of 2.3%.
Hearing Disability Correlation Summary
| Measurement | Immigrants from Dominica | Immigrants from Uzbekistan |
| Minimum | 1.4% | 0.39% |
| Maximum | 9.1% | 4.9% |
| Range | 7.7% | 4.5% |
| Mean | 2.9% | 2.8% |
| Median | 2.7% | 2.8% |
| Interquartile 25% (IQ1) | 2.1% | 2.4% |
| Interquartile 75% (IQ3) | 3.2% | 3.2% |
| Interquartile Range (IQR) | 1.1% | 0.84% |
| Standard Deviation (Sample) | 1.2% | 0.89% |
| Standard Deviation (Population) | 1.2% | 0.88% |
Demographics Similar to Immigrants from Dominica and Immigrants from Uzbekistan by Hearing Disability
In terms of hearing disability, the demographic groups most similar to Immigrants from Dominica are Venezuelan (2.6%, a difference of 0.10%), Nigerian (2.6%, a difference of 0.13%), Immigrants from Israel (2.6%, a difference of 0.15%), Immigrants from Singapore (2.6%, a difference of 0.21%), and Immigrants from South America (2.7%, a difference of 0.34%). Similarly, the demographic groups most similar to Immigrants from Uzbekistan are Immigrants from Colombia (2.7%, a difference of 0.0%), Indian (Asian) (2.7%, a difference of 0.060%), Immigrants from Egypt (2.7%, a difference of 0.13%), Immigrants from Eritrea (2.7%, a difference of 0.20%), and Immigrants from Peru (2.7%, a difference of 0.31%).
| Demographics | Rating | Rank | Hearing Disability |
| Senegalese | 99.4 /100 | #43 | Exceptional 2.6% |
| Nigerians | 99.4 /100 | #44 | Exceptional 2.6% |
| Venezuelans | 99.4 /100 | #45 | Exceptional 2.6% |
| Immigrants | Dominica | 99.3 /100 | #46 | Exceptional 2.6% |
| Immigrants | Israel | 99.3 /100 | #47 | Exceptional 2.6% |
| Immigrants | Singapore | 99.3 /100 | #48 | Exceptional 2.6% |
| Immigrants | South America | 99.2 /100 | #49 | Exceptional 2.7% |
| Paraguayans | 99.2 /100 | #50 | Exceptional 2.7% |
| Immigrants | Hong Kong | 99.2 /100 | #51 | Exceptional 2.7% |
| Jamaicans | 99.0 /100 | #52 | Exceptional 2.7% |
| Immigrants | Eastern Asia | 99.0 /100 | #53 | Exceptional 2.7% |
| Ethiopians | 99.0 /100 | #54 | Exceptional 2.7% |
| Immigrants | Ethiopia | 99.0 /100 | #55 | Exceptional 2.7% |
| Immigrants | Nicaragua | 99.0 /100 | #56 | Exceptional 2.7% |
| South Americans | 99.0 /100 | #57 | Exceptional 2.7% |
| Immigrants | Peru | 98.6 /100 | #58 | Exceptional 2.7% |
| Immigrants | Eritrea | 98.5 /100 | #59 | Exceptional 2.7% |
| Immigrants | Egypt | 98.5 /100 | #60 | Exceptional 2.7% |
| Immigrants | Uzbekistan | 98.4 /100 | #61 | Exceptional 2.7% |
| Immigrants | Colombia | 98.4 /100 | #62 | Exceptional 2.7% |
| Indians (Asian) | 98.4 /100 | #63 | Exceptional 2.7% |