Immigrants from Dominica vs Polish In Labor Force | Age > 16
COMPARE
Immigrants from Dominica
Polish
In Labor Force | Age > 16
In Labor Force | Age > 16 Comparison
Immigrants from Dominica
Poles
64.5%
IN LABOR FORCE | AGE > 16
3.5/ 100
METRIC RATING
241st/ 347
METRIC RANK
64.7%
IN LABOR FORCE | AGE > 16
8.3/ 100
METRIC RATING
227th/ 347
METRIC RANK
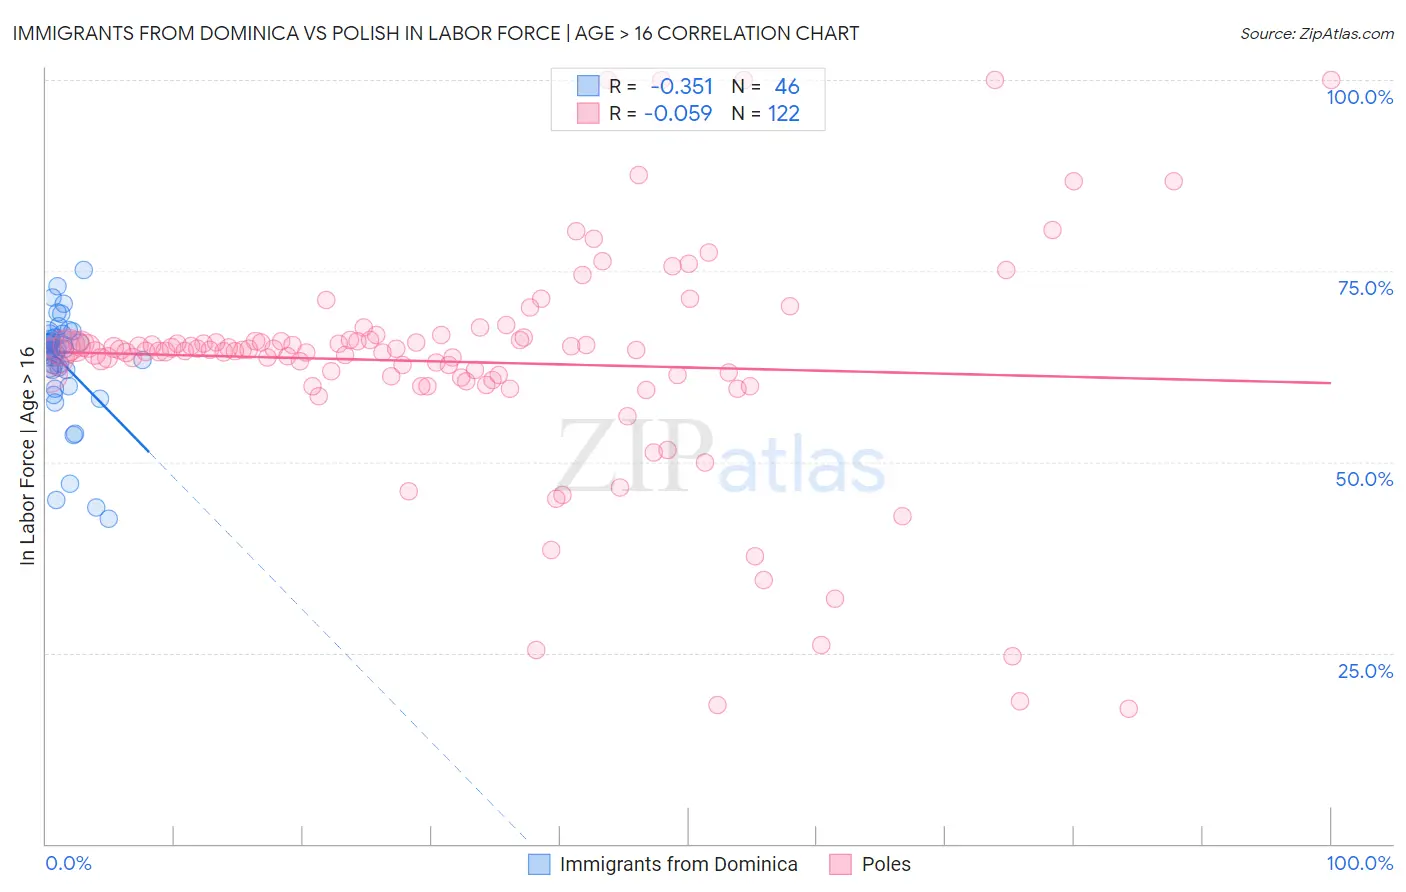
Immigrants from Dominica vs Polish In Labor Force | Age > 16 Correlation Chart
The statistical analysis conducted on geographies consisting of 83,796,433 people shows a mild negative correlation between the proportion of Immigrants from Dominica and labor force participation rate among population ages 16 and over in the United States with a correlation coefficient (R) of -0.351 and weighted average of 64.5%. Similarly, the statistical analysis conducted on geographies consisting of 560,604,274 people shows a slight negative correlation between the proportion of Poles and labor force participation rate among population ages 16 and over in the United States with a correlation coefficient (R) of -0.059 and weighted average of 64.7%, a difference of 0.25%.
In Labor Force | Age > 16 Correlation Summary
| Measurement | Immigrants from Dominica | Polish |
| Minimum | 42.6% | 17.6% |
| Maximum | 75.1% | 100.0% |
| Range | 32.5% | 82.4% |
| Mean | 62.8% | 63.1% |
| Median | 64.7% | 64.6% |
| Interquartile 25% (IQ1) | 62.0% | 61.1% |
| Interquartile 75% (IQ3) | 66.6% | 65.9% |
| Interquartile Range (IQR) | 4.6% | 4.9% |
| Standard Deviation (Sample) | 7.1% | 14.8% |
| Standard Deviation (Population) | 7.0% | 14.8% |
Demographics Similar to Immigrants from Dominica and Poles by In Labor Force | Age > 16
In terms of in labor force | age > 16, the demographic groups most similar to Immigrants from Dominica are Immigrants from Bangladesh (64.5%, a difference of 0.0%), Immigrants from Netherlands (64.5%, a difference of 0.010%), Immigrants from Hungary (64.5%, a difference of 0.020%), Lebanese (64.5%, a difference of 0.030%), and Immigrants from Lebanon (64.5%, a difference of 0.030%). Similarly, the demographic groups most similar to Poles are European (64.7%, a difference of 0.0%), Northern European (64.7%, a difference of 0.0%), Immigrants from Jamaica (64.7%, a difference of 0.020%), Croatian (64.7%, a difference of 0.020%), and British (64.7%, a difference of 0.040%).
| Demographics | Rating | Rank | In Labor Force | Age > 16 |
| Immigrants | Jamaica | 8.8 /100 | #224 | Tragic 64.7% |
| Croatians | 8.8 /100 | #225 | Tragic 64.7% |
| Europeans | 8.3 /100 | #226 | Tragic 64.7% |
| Poles | 8.3 /100 | #227 | Tragic 64.7% |
| Northern Europeans | 8.2 /100 | #228 | Tragic 64.7% |
| British | 7.3 /100 | #229 | Tragic 64.7% |
| Chinese | 7.3 /100 | #230 | Tragic 64.7% |
| Immigrants | Northern Europe | 7.2 /100 | #231 | Tragic 64.7% |
| Africans | 5.8 /100 | #232 | Tragic 64.6% |
| Slavs | 4.9 /100 | #233 | Tragic 64.6% |
| Vietnamese | 4.7 /100 | #234 | Tragic 64.6% |
| Austrians | 4.6 /100 | #235 | Tragic 64.6% |
| Immigrants | Norway | 4.6 /100 | #236 | Tragic 64.6% |
| Italians | 4.6 /100 | #237 | Tragic 64.6% |
| Lebanese | 3.9 /100 | #238 | Tragic 64.5% |
| Immigrants | Hungary | 3.8 /100 | #239 | Tragic 64.5% |
| Immigrants | Bangladesh | 3.6 /100 | #240 | Tragic 64.5% |
| Immigrants | Dominica | 3.5 /100 | #241 | Tragic 64.5% |
| Immigrants | Netherlands | 3.4 /100 | #242 | Tragic 64.5% |
| Immigrants | Lebanon | 3.2 /100 | #243 | Tragic 64.5% |
| Tsimshian | 3.1 /100 | #244 | Tragic 64.5% |