Immigrants from Denmark vs Pueblo Ambulatory Disability
COMPARE
Immigrants from Denmark
Pueblo
Ambulatory Disability
Ambulatory Disability Comparison
Immigrants from Denmark
Pueblo
5.8%
AMBULATORY DISABILITY
98.6/ 100
METRIC RATING
93rd/ 347
METRIC RANK
7.6%
AMBULATORY DISABILITY
0.0/ 100
METRIC RATING
329th/ 347
METRIC RANK
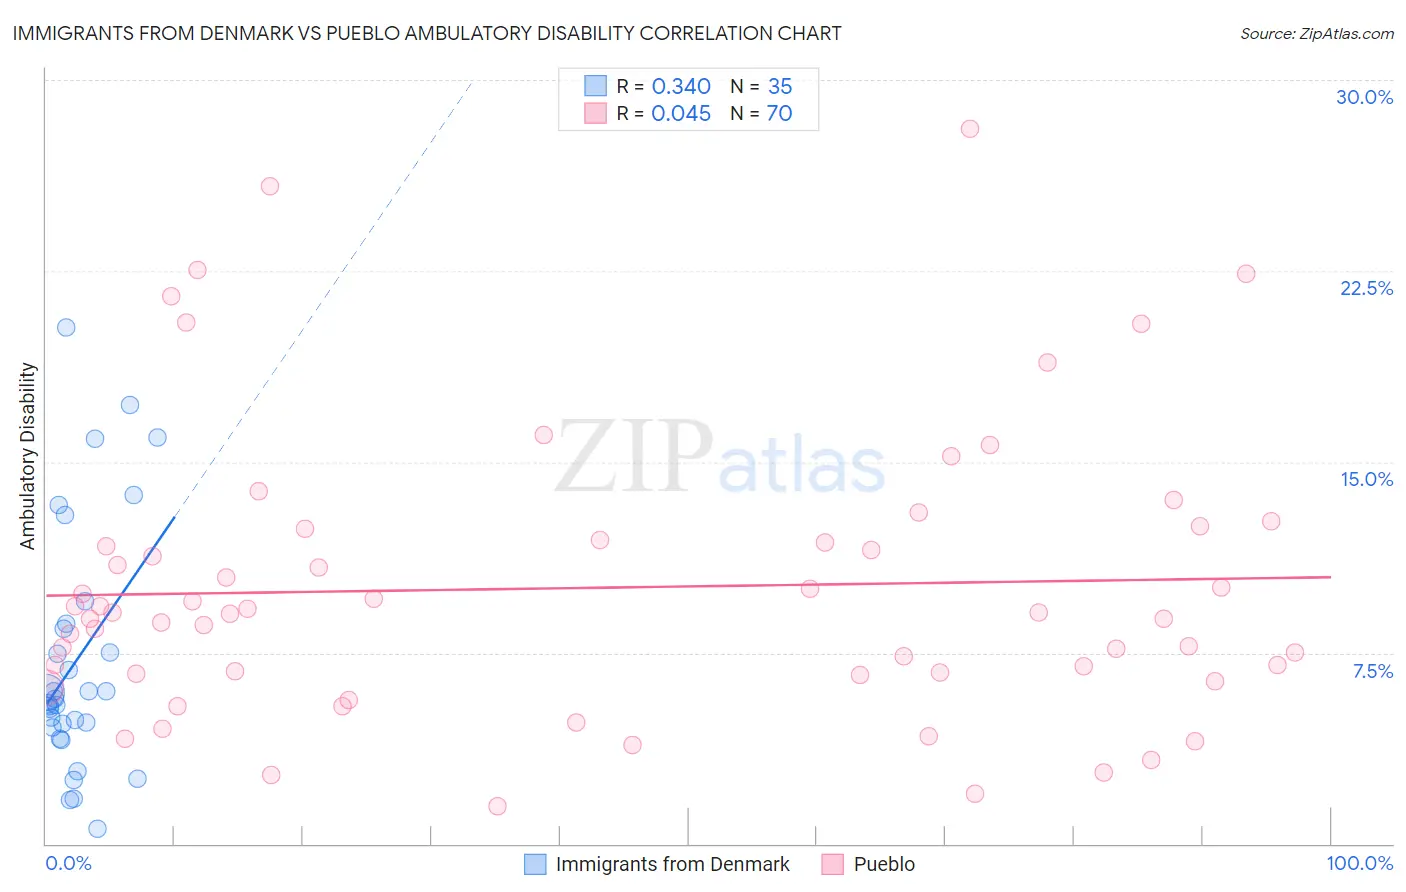
Immigrants from Denmark vs Pueblo Ambulatory Disability Correlation Chart
The statistical analysis conducted on geographies consisting of 136,424,948 people shows a mild positive correlation between the proportion of Immigrants from Denmark and percentage of population with ambulatory disability in the United States with a correlation coefficient (R) of 0.340 and weighted average of 5.8%. Similarly, the statistical analysis conducted on geographies consisting of 120,067,140 people shows no correlation between the proportion of Pueblo and percentage of population with ambulatory disability in the United States with a correlation coefficient (R) of 0.045 and weighted average of 7.6%, a difference of 31.6%.
Ambulatory Disability Correlation Summary
| Measurement | Immigrants from Denmark | Pueblo |
| Minimum | 0.61% | 1.5% |
| Maximum | 20.3% | 28.1% |
| Range | 19.6% | 26.6% |
| Mean | 7.2% | 10.1% |
| Median | 5.7% | 9.1% |
| Interquartile 25% (IQ1) | 4.6% | 6.7% |
| Interquartile 75% (IQ3) | 8.7% | 11.9% |
| Interquartile Range (IQR) | 4.1% | 5.2% |
| Standard Deviation (Sample) | 4.8% | 5.6% |
| Standard Deviation (Population) | 4.7% | 5.6% |
Similar Demographics by Ambulatory Disability
Demographics Similar to Immigrants from Denmark by Ambulatory Disability
In terms of ambulatory disability, the demographic groups most similar to Immigrants from Denmark are Immigrants from Sierra Leone (5.8%, a difference of 0.010%), Immigrants from Sudan (5.8%, a difference of 0.17%), Bhutanese (5.8%, a difference of 0.18%), Australian (5.8%, a difference of 0.18%), and Kenyan (5.8%, a difference of 0.19%).
| Demographics | Rating | Rank | Ambulatory Disability |
| Latvians | 99.0 /100 | #86 | Exceptional 5.7% |
| Immigrants | Chile | 98.9 /100 | #87 | Exceptional 5.8% |
| Soviet Union | 98.9 /100 | #88 | Exceptional 5.8% |
| Bhutanese | 98.8 /100 | #89 | Exceptional 5.8% |
| Australians | 98.8 /100 | #90 | Exceptional 5.8% |
| Immigrants | Sudan | 98.8 /100 | #91 | Exceptional 5.8% |
| Immigrants | Sierra Leone | 98.6 /100 | #92 | Exceptional 5.8% |
| Immigrants | Denmark | 98.6 /100 | #93 | Exceptional 5.8% |
| Kenyans | 98.4 /100 | #94 | Exceptional 5.8% |
| Immigrants | El Salvador | 98.4 /100 | #95 | Exceptional 5.8% |
| Salvadorans | 98.4 /100 | #96 | Exceptional 5.8% |
| Immigrants | Somalia | 98.3 /100 | #97 | Exceptional 5.8% |
| Immigrants | Lebanon | 98.3 /100 | #98 | Exceptional 5.8% |
| Immigrants | Northern Europe | 98.2 /100 | #99 | Exceptional 5.8% |
| Immigrants | Serbia | 97.9 /100 | #100 | Exceptional 5.8% |
Demographics Similar to Pueblo by Ambulatory Disability
In terms of ambulatory disability, the demographic groups most similar to Pueblo are Hopi (7.6%, a difference of 0.040%), Native/Alaskan (7.5%, a difference of 0.98%), Black/African American (7.5%, a difference of 0.99%), Comanche (7.5%, a difference of 1.1%), and Navajo (7.5%, a difference of 1.2%).
| Demographics | Rating | Rank | Ambulatory Disability |
| Osage | 0.0 /100 | #322 | Tragic 7.4% |
| Americans | 0.0 /100 | #323 | Tragic 7.4% |
| Navajo | 0.0 /100 | #324 | Tragic 7.5% |
| Comanche | 0.0 /100 | #325 | Tragic 7.5% |
| Blacks/African Americans | 0.0 /100 | #326 | Tragic 7.5% |
| Natives/Alaskans | 0.0 /100 | #327 | Tragic 7.5% |
| Hopi | 0.0 /100 | #328 | Tragic 7.6% |
| Pueblo | 0.0 /100 | #329 | Tragic 7.6% |
| Paiute | 0.0 /100 | #330 | Tragic 7.7% |
| Cajuns | 0.0 /100 | #331 | Tragic 7.8% |
| Menominee | 0.0 /100 | #332 | Tragic 7.8% |
| Cherokee | 0.0 /100 | #333 | Tragic 7.9% |
| Yuman | 0.0 /100 | #334 | Tragic 7.9% |
| Chickasaw | 0.0 /100 | #335 | Tragic 8.0% |
| Seminole | 0.0 /100 | #336 | Tragic 8.0% |