Immigrants from Denmark vs Immigrants from Uruguay Single Male Poverty
COMPARE
Immigrants from Denmark
Immigrants from Uruguay
Single Male Poverty
Single Male Poverty Comparison
Immigrants from Denmark
Immigrants from Uruguay
13.2%
SINGLE MALE POVERTY
8.7/ 100
METRIC RATING
225th/ 347
METRIC RANK
11.9%
SINGLE MALE POVERTY
99.6/ 100
METRIC RATING
66th/ 347
METRIC RANK
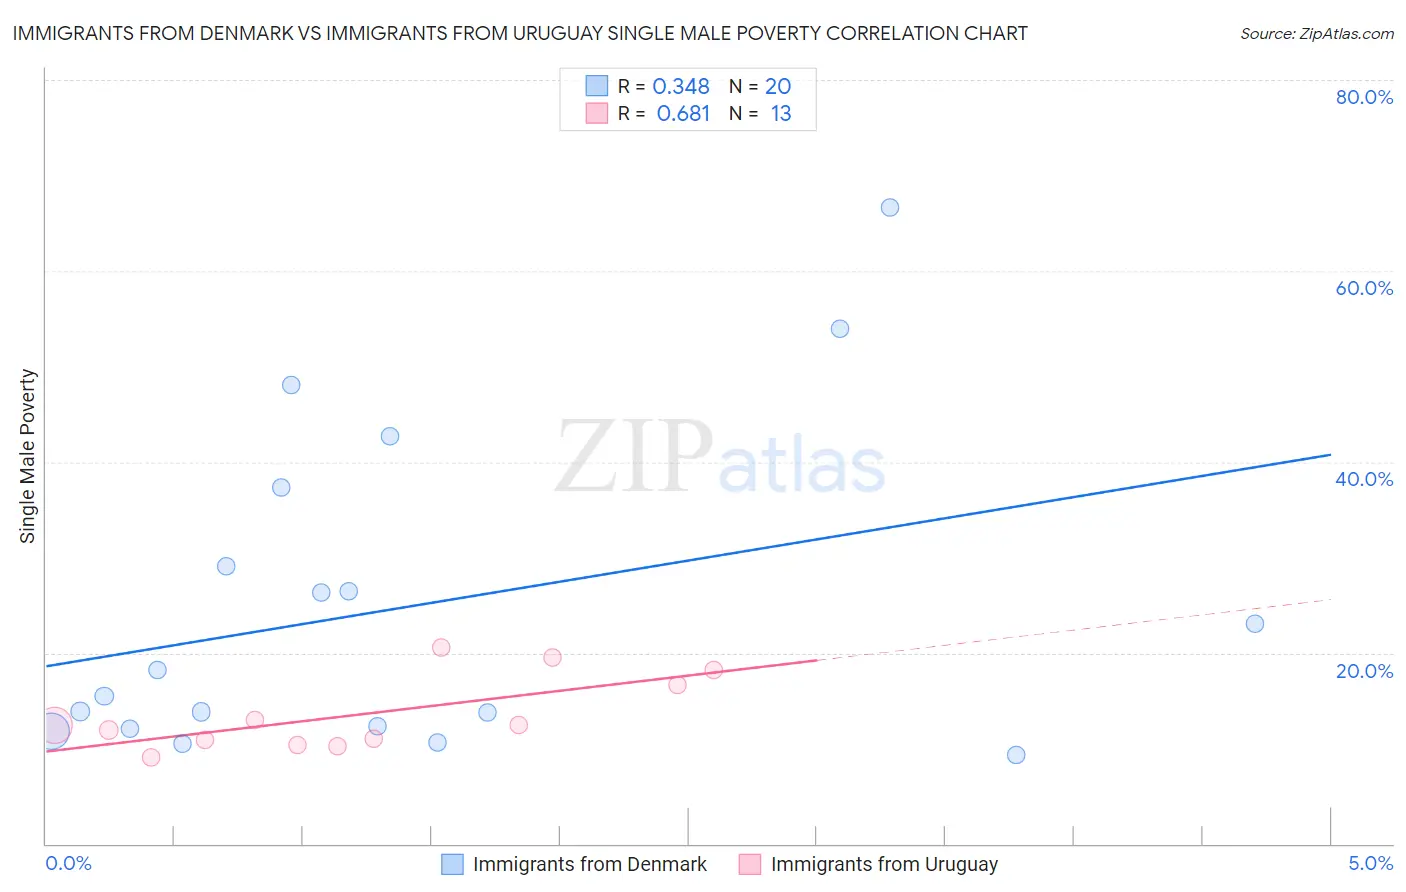
Immigrants from Denmark vs Immigrants from Uruguay Single Male Poverty Correlation Chart
The statistical analysis conducted on geographies consisting of 127,193,703 people shows a mild positive correlation between the proportion of Immigrants from Denmark and poverty level among single males in the United States with a correlation coefficient (R) of 0.348 and weighted average of 13.2%. Similarly, the statistical analysis conducted on geographies consisting of 126,342,456 people shows a significant positive correlation between the proportion of Immigrants from Uruguay and poverty level among single males in the United States with a correlation coefficient (R) of 0.681 and weighted average of 11.9%, a difference of 11.3%.
Single Male Poverty Correlation Summary
| Measurement | Immigrants from Denmark | Immigrants from Uruguay |
| Minimum | 9.3% | 9.1% |
| Maximum | 66.7% | 20.5% |
| Range | 57.4% | 11.5% |
| Mean | 24.8% | 13.6% |
| Median | 16.8% | 12.4% |
| Interquartile 25% (IQ1) | 12.2% | 10.6% |
| Interquartile 75% (IQ3) | 33.2% | 17.5% |
| Interquartile Range (IQR) | 21.1% | 6.9% |
| Standard Deviation (Sample) | 16.7% | 3.8% |
| Standard Deviation (Population) | 16.2% | 3.7% |
Similar Demographics by Single Male Poverty
Demographics Similar to Immigrants from Denmark by Single Male Poverty
In terms of single male poverty, the demographic groups most similar to Immigrants from Denmark are Somali (13.2%, a difference of 0.050%), Immigrants from the Azores (13.2%, a difference of 0.090%), Jamaican (13.2%, a difference of 0.16%), Immigrants from Western Europe (13.2%, a difference of 0.20%), and New Zealander (13.2%, a difference of 0.29%).
| Demographics | Rating | Rank | Single Male Poverty |
| Scandinavians | 12.9 /100 | #218 | Poor 13.1% |
| Immigrants | Burma/Myanmar | 12.6 /100 | #219 | Poor 13.1% |
| Central Americans | 10.9 /100 | #220 | Poor 13.2% |
| New Zealanders | 10.7 /100 | #221 | Poor 13.2% |
| Immigrants | Western Europe | 10.0 /100 | #222 | Poor 13.2% |
| Immigrants | Azores | 9.3 /100 | #223 | Tragic 13.2% |
| Somalis | 9.1 /100 | #224 | Tragic 13.2% |
| Immigrants | Denmark | 8.7 /100 | #225 | Tragic 13.2% |
| Jamaicans | 7.7 /100 | #226 | Tragic 13.2% |
| Haitians | 7.0 /100 | #227 | Tragic 13.2% |
| Lebanese | 6.6 /100 | #228 | Tragic 13.2% |
| Europeans | 6.2 /100 | #229 | Tragic 13.3% |
| Ghanaians | 6.1 /100 | #230 | Tragic 13.3% |
| Slavs | 5.3 /100 | #231 | Tragic 13.3% |
| Immigrants | Caribbean | 5.0 /100 | #232 | Tragic 13.3% |
Demographics Similar to Immigrants from Uruguay by Single Male Poverty
In terms of single male poverty, the demographic groups most similar to Immigrants from Uruguay are Laotian (11.9%, a difference of 0.0%), Immigrants from Ukraine (11.9%, a difference of 0.020%), Immigrants from Croatia (11.9%, a difference of 0.030%), Immigrants from Russia (11.9%, a difference of 0.060%), and Immigrants from Nepal (11.9%, a difference of 0.080%).
| Demographics | Rating | Rank | Single Male Poverty |
| Brazilians | 99.8 /100 | #59 | Exceptional 11.8% |
| Peruvians | 99.8 /100 | #60 | Exceptional 11.8% |
| Cambodians | 99.8 /100 | #61 | Exceptional 11.8% |
| Immigrants | Sri Lanka | 99.7 /100 | #62 | Exceptional 11.8% |
| Immigrants | Belarus | 99.7 /100 | #63 | Exceptional 11.8% |
| Immigrants | Eastern Europe | 99.6 /100 | #64 | Exceptional 11.8% |
| Laotians | 99.6 /100 | #65 | Exceptional 11.9% |
| Immigrants | Uruguay | 99.6 /100 | #66 | Exceptional 11.9% |
| Immigrants | Ukraine | 99.6 /100 | #67 | Exceptional 11.9% |
| Immigrants | Croatia | 99.6 /100 | #68 | Exceptional 11.9% |
| Immigrants | Russia | 99.6 /100 | #69 | Exceptional 11.9% |
| Immigrants | Nepal | 99.6 /100 | #70 | Exceptional 11.9% |
| Immigrants | Greece | 99.6 /100 | #71 | Exceptional 11.9% |
| Immigrants | Argentina | 99.5 /100 | #72 | Exceptional 11.9% |
| Argentineans | 99.5 /100 | #73 | Exceptional 11.9% |