Immigrants from Denmark vs Immigrants from Malaysia Householder Income Under 25 years
COMPARE
Immigrants from Denmark
Immigrants from Malaysia
Householder Income Under 25 years
Householder Income Under 25 years Comparison
Immigrants from Denmark
Immigrants from Malaysia
$52,612
HOUSEHOLDER INCOME UNDER 25 YEARS
73.8/ 100
METRIC RATING
155th/ 347
METRIC RANK
$54,179
HOUSEHOLDER INCOME UNDER 25 YEARS
99.2/ 100
METRIC RATING
95th/ 347
METRIC RANK
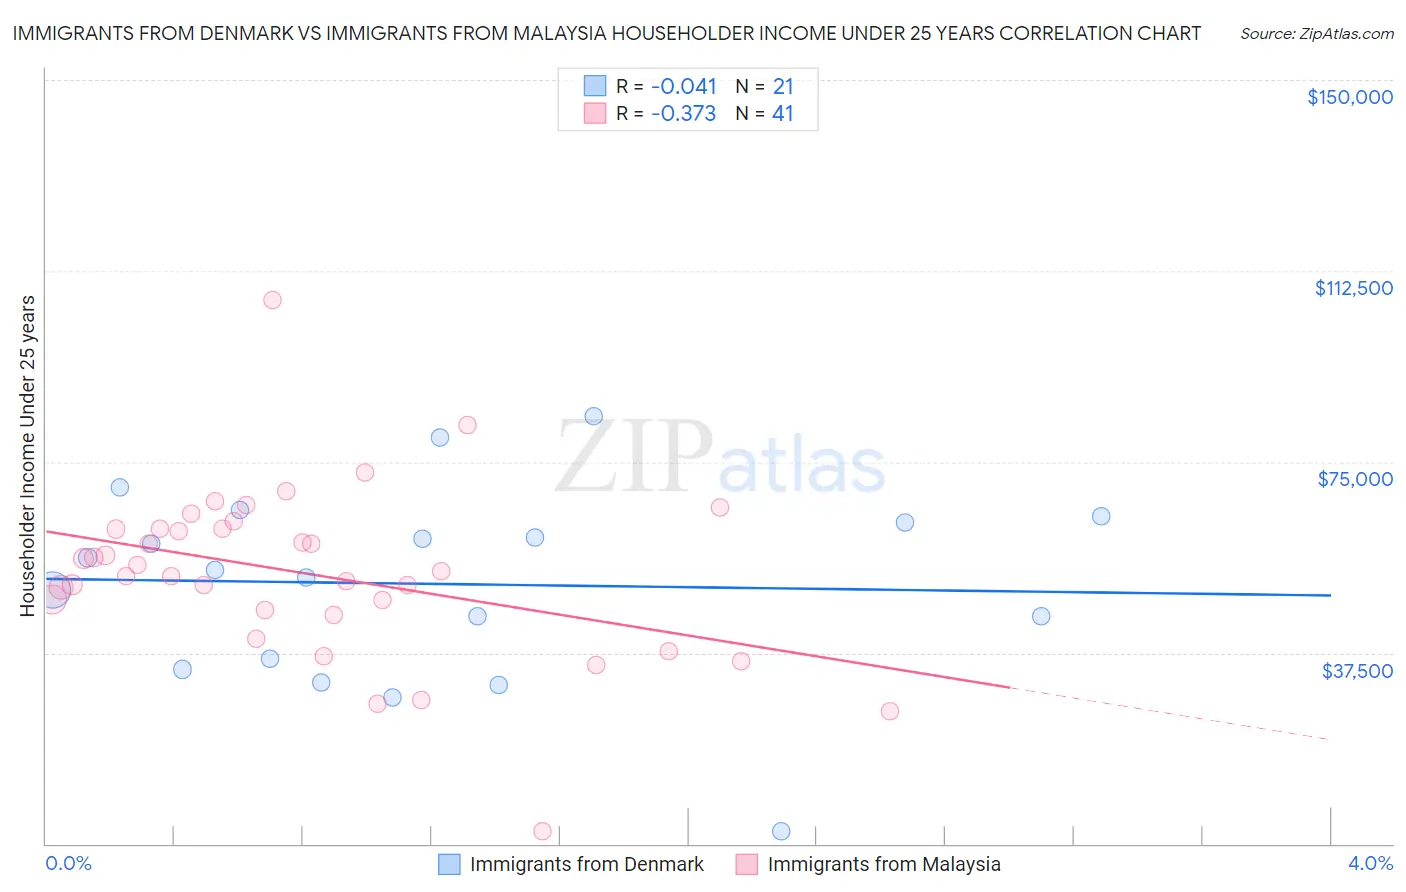
Immigrants from Denmark vs Immigrants from Malaysia Householder Income Under 25 years Correlation Chart
The statistical analysis conducted on geographies consisting of 123,999,951 people shows no correlation between the proportion of Immigrants from Denmark and household income with householder under the age of 25 in the United States with a correlation coefficient (R) of -0.041 and weighted average of $52,612. Similarly, the statistical analysis conducted on geographies consisting of 176,157,143 people shows a mild negative correlation between the proportion of Immigrants from Malaysia and household income with householder under the age of 25 in the United States with a correlation coefficient (R) of -0.373 and weighted average of $54,179, a difference of 3.0%.
Householder Income Under 25 years Correlation Summary
| Measurement | Immigrants from Denmark | Immigrants from Malaysia |
| Minimum | $2,499 | $2,499 |
| Maximum | $84,000 | $106,721 |
| Range | $81,501 | $104,222 |
| Mean | $51,040 | $53,085 |
| Median | $53,874 | $53,409 |
| Interquartile 25% (IQ1) | $35,276 | $45,363 |
| Interquartile 75% (IQ3) | $63,691 | $61,933 |
| Interquartile Range (IQR) | $28,415 | $16,570 |
| Standard Deviation (Sample) | $19,074 | $17,081 |
| Standard Deviation (Population) | $18,615 | $16,871 |
Similar Demographics by Householder Income Under 25 years
Demographics Similar to Immigrants from Denmark by Householder Income Under 25 years
In terms of householder income under 25 years, the demographic groups most similar to Immigrants from Denmark are Immigrants from Nepal ($52,611, a difference of 0.0%), Immigrants from the Azores ($52,621, a difference of 0.020%), Central American ($52,626, a difference of 0.030%), Trinidadian and Tobagonian ($52,631, a difference of 0.040%), and Ghanaian ($52,594, a difference of 0.040%).
| Demographics | Rating | Rank | Householder Income Under 25 years |
| French Canadians | 76.5 /100 | #148 | Good $52,672 |
| Scandinavians | 75.7 /100 | #149 | Good $52,654 |
| Immigrants | Costa Rica | 75.2 /100 | #150 | Good $52,643 |
| Immigrants | Scotland | 75.0 /100 | #151 | Good $52,638 |
| Trinidadians and Tobagonians | 74.6 /100 | #152 | Good $52,631 |
| Central Americans | 74.4 /100 | #153 | Good $52,626 |
| Immigrants | Azores | 74.2 /100 | #154 | Good $52,621 |
| Immigrants | Denmark | 73.8 /100 | #155 | Good $52,612 |
| Immigrants | Nepal | 73.7 /100 | #156 | Good $52,611 |
| Ghanaians | 72.9 /100 | #157 | Good $52,594 |
| Immigrants | Netherlands | 72.8 /100 | #158 | Good $52,592 |
| Mongolians | 70.2 /100 | #159 | Good $52,540 |
| Immigrants | Turkey | 68.3 /100 | #160 | Good $52,503 |
| Uruguayans | 66.2 /100 | #161 | Good $52,465 |
| Immigrants | Cambodia | 65.4 /100 | #162 | Good $52,450 |
Demographics Similar to Immigrants from Malaysia by Householder Income Under 25 years
In terms of householder income under 25 years, the demographic groups most similar to Immigrants from Malaysia are Immigrants from Sierra Leone ($54,190, a difference of 0.020%), Immigrants from Argentina ($54,209, a difference of 0.050%), Argentinean ($54,154, a difference of 0.050%), Immigrants from St. Vincent and the Grenadines ($54,230, a difference of 0.090%), and Immigrants from Egypt ($54,239, a difference of 0.11%).
| Demographics | Rating | Rank | Householder Income Under 25 years |
| Yakama | 99.5 /100 | #88 | Exceptional $54,321 |
| Immigrants | South America | 99.4 /100 | #89 | Exceptional $54,268 |
| Turks | 99.4 /100 | #90 | Exceptional $54,266 |
| Immigrants | Egypt | 99.3 /100 | #91 | Exceptional $54,239 |
| Immigrants | St. Vincent and the Grenadines | 99.3 /100 | #92 | Exceptional $54,230 |
| Immigrants | Argentina | 99.3 /100 | #93 | Exceptional $54,209 |
| Immigrants | Sierra Leone | 99.3 /100 | #94 | Exceptional $54,190 |
| Immigrants | Malaysia | 99.2 /100 | #95 | Exceptional $54,179 |
| Argentineans | 99.2 /100 | #96 | Exceptional $54,154 |
| Immigrants | Portugal | 99.1 /100 | #97 | Exceptional $54,105 |
| Eastern Europeans | 99.0 /100 | #98 | Exceptional $54,066 |
| Alaska Natives | 98.8 /100 | #99 | Exceptional $54,000 |
| Immigrants | Kazakhstan | 98.8 /100 | #100 | Exceptional $53,990 |
| South Americans | 98.6 /100 | #101 | Exceptional $53,939 |
| Ecuadorians | 98.5 /100 | #102 | Exceptional $53,911 |