Immigrants from Cuba vs Immigrants from Armenia Self-Care Disability
COMPARE
Immigrants from Cuba
Immigrants from Armenia
Self-Care Disability
Self-Care Disability Comparison
Immigrants from Cuba
Immigrants from Armenia
2.8%
SELF-CARE DISABILITY
0.0/ 100
METRIC RATING
315th/ 347
METRIC RANK
4.2%
SELF-CARE DISABILITY
0.0/ 100
METRIC RATING
347th/ 347
METRIC RANK
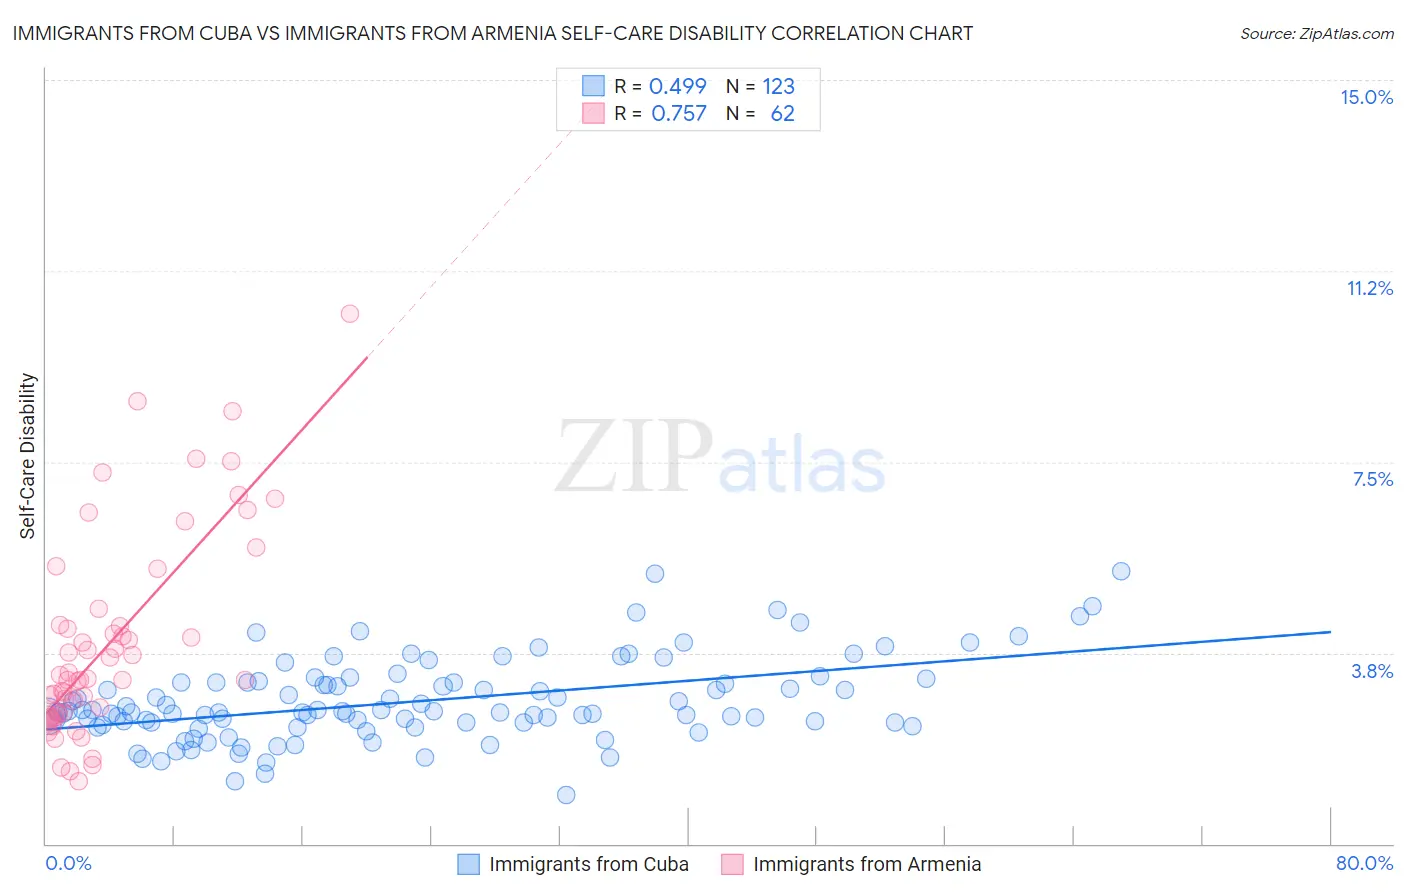
Immigrants from Cuba vs Immigrants from Armenia Self-Care Disability Correlation Chart
The statistical analysis conducted on geographies consisting of 325,827,675 people shows a moderate positive correlation between the proportion of Immigrants from Cuba and percentage of population with self-care disability in the United States with a correlation coefficient (R) of 0.499 and weighted average of 2.8%. Similarly, the statistical analysis conducted on geographies consisting of 97,700,999 people shows a strong positive correlation between the proportion of Immigrants from Armenia and percentage of population with self-care disability in the United States with a correlation coefficient (R) of 0.757 and weighted average of 4.2%, a difference of 47.0%.
Self-Care Disability Correlation Summary
| Measurement | Immigrants from Cuba | Immigrants from Armenia |
| Minimum | 0.96% | 1.2% |
| Maximum | 5.4% | 10.4% |
| Range | 4.4% | 9.2% |
| Mean | 2.8% | 3.9% |
| Median | 2.6% | 3.2% |
| Interquartile 25% (IQ1) | 2.4% | 2.6% |
| Interquartile 75% (IQ3) | 3.2% | 4.3% |
| Interquartile Range (IQR) | 0.79% | 1.7% |
| Standard Deviation (Sample) | 0.80% | 2.0% |
| Standard Deviation (Population) | 0.80% | 2.0% |
Similar Demographics by Self-Care Disability
Demographics Similar to Immigrants from Cuba by Self-Care Disability
In terms of self-care disability, the demographic groups most similar to Immigrants from Cuba are Menominee (2.8%, a difference of 0.10%), Creek (2.8%, a difference of 0.21%), Immigrants from Dominica (2.8%, a difference of 0.23%), Assyrian/Chaldean/Syriac (2.8%, a difference of 0.24%), and Spanish American Indian (2.9%, a difference of 0.40%).
| Demographics | Rating | Rank | Self-Care Disability |
| Immigrants | Grenada | 0.0 /100 | #308 | Tragic 2.8% |
| Bangladeshis | 0.0 /100 | #309 | Tragic 2.8% |
| British West Indians | 0.0 /100 | #310 | Tragic 2.8% |
| Puget Sound Salish | 0.0 /100 | #311 | Tragic 2.8% |
| Immigrants | Caribbean | 0.0 /100 | #312 | Tragic 2.8% |
| Spanish Americans | 0.0 /100 | #313 | Tragic 2.8% |
| Creek | 0.0 /100 | #314 | Tragic 2.8% |
| Immigrants | Cuba | 0.0 /100 | #315 | Tragic 2.8% |
| Menominee | 0.0 /100 | #316 | Tragic 2.8% |
| Immigrants | Dominica | 0.0 /100 | #317 | Tragic 2.8% |
| Assyrians/Chaldeans/Syriacs | 0.0 /100 | #318 | Tragic 2.8% |
| Spanish American Indians | 0.0 /100 | #319 | Tragic 2.9% |
| Chickasaw | 0.0 /100 | #320 | Tragic 2.9% |
| Navajo | 0.0 /100 | #321 | Tragic 2.9% |
| Comanche | 0.0 /100 | #322 | Tragic 2.9% |
Demographics Similar to Immigrants from Armenia by Self-Care Disability
In terms of self-care disability, the demographic groups most similar to Immigrants from Armenia are Puerto Rican (3.7%, a difference of 13.7%), Armenian (3.4%, a difference of 22.7%), Pueblo (3.3%, a difference of 28.2%), Tohono O'odham (3.1%, a difference of 34.1%), and Colville (3.1%, a difference of 34.2%).
| Demographics | Rating | Rank | Self-Care Disability |
| Dutch West Indians | 0.0 /100 | #333 | Tragic 3.0% |
| Houma | 0.0 /100 | #334 | Tragic 3.0% |
| Immigrants | Azores | 0.0 /100 | #335 | Tragic 3.0% |
| Immigrants | Yemen | 0.0 /100 | #336 | Tragic 3.0% |
| Choctaw | 0.0 /100 | #337 | Tragic 3.0% |
| Cape Verdeans | 0.0 /100 | #338 | Tragic 3.0% |
| Immigrants | Dominican Republic | 0.0 /100 | #339 | Tragic 3.0% |
| Immigrants | Cabo Verde | 0.0 /100 | #340 | Tragic 3.1% |
| Dominicans | 0.0 /100 | #341 | Tragic 3.1% |
| Colville | 0.0 /100 | #342 | Tragic 3.1% |
| Tohono O'odham | 0.0 /100 | #343 | Tragic 3.1% |
| Pueblo | 0.0 /100 | #344 | Tragic 3.3% |
| Armenians | 0.0 /100 | #345 | Tragic 3.4% |
| Puerto Ricans | 0.0 /100 | #346 | Tragic 3.7% |
| Immigrants | Armenia | 0.0 /100 | #347 | Tragic 4.2% |