Immigrants from Colombia vs Nicaraguan Disability Age Over 75
COMPARE
Immigrants from Colombia
Nicaraguan
Disability Age Over 75
Disability Age Over 75 Comparison
Immigrants from Colombia
Nicaraguans
46.7%
DISABILITY AGE OVER 75
92.6/ 100
METRIC RATING
123rd/ 347
METRIC RANK
48.3%
DISABILITY AGE OVER 75
3.0/ 100
METRIC RATING
238th/ 347
METRIC RANK
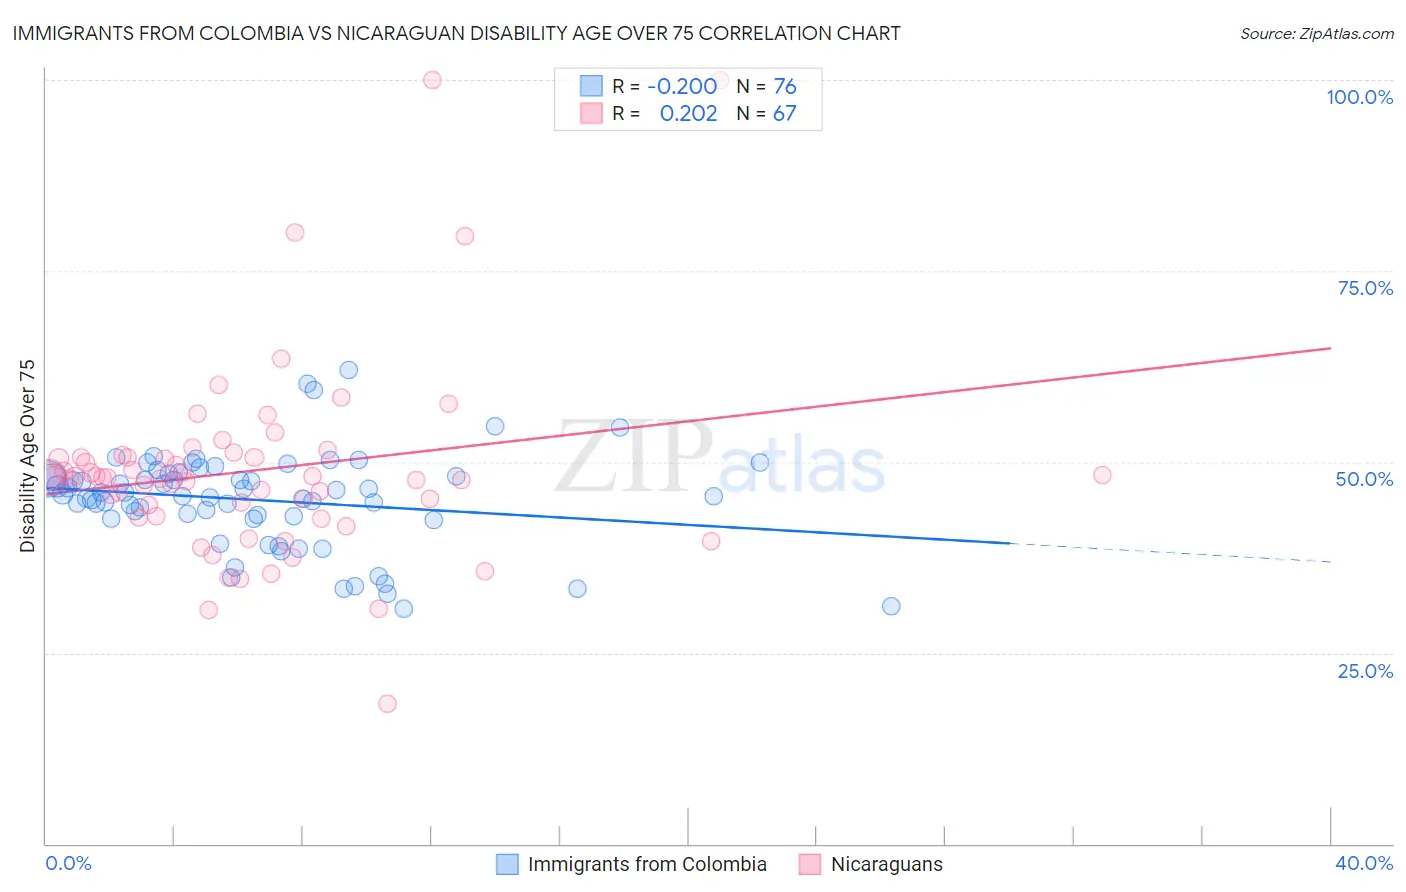
Immigrants from Colombia vs Nicaraguan Disability Age Over 75 Correlation Chart
The statistical analysis conducted on geographies consisting of 378,064,071 people shows a poor negative correlation between the proportion of Immigrants from Colombia and percentage of population with a disability over the age of 75 in the United States with a correlation coefficient (R) of -0.200 and weighted average of 46.7%. Similarly, the statistical analysis conducted on geographies consisting of 285,291,775 people shows a weak positive correlation between the proportion of Nicaraguans and percentage of population with a disability over the age of 75 in the United States with a correlation coefficient (R) of 0.202 and weighted average of 48.3%, a difference of 3.4%.
Disability Age Over 75 Correlation Summary
| Measurement | Immigrants from Colombia | Nicaraguan |
| Minimum | 30.8% | 18.3% |
| Maximum | 62.0% | 100.0% |
| Range | 31.2% | 81.7% |
| Mean | 45.0% | 48.9% |
| Median | 45.6% | 47.9% |
| Interquartile 25% (IQ1) | 42.8% | 42.8% |
| Interquartile 75% (IQ3) | 48.3% | 50.6% |
| Interquartile Range (IQR) | 5.5% | 7.8% |
| Standard Deviation (Sample) | 6.2% | 13.0% |
| Standard Deviation (Population) | 6.2% | 12.9% |
Similar Demographics by Disability Age Over 75
Demographics Similar to Immigrants from Colombia by Disability Age Over 75
In terms of disability age over 75, the demographic groups most similar to Immigrants from Colombia are Immigrants from Albania (46.6%, a difference of 0.050%), Immigrants from South America (46.7%, a difference of 0.060%), Colombian (46.7%, a difference of 0.090%), Scandinavian (46.6%, a difference of 0.10%), and European (46.7%, a difference of 0.10%).
| Demographics | Rating | Rank | Disability Age Over 75 |
| Indians (Asian) | 95.7 /100 | #116 | Exceptional 46.5% |
| Hungarians | 95.3 /100 | #117 | Exceptional 46.5% |
| Czechoslovakians | 94.7 /100 | #118 | Exceptional 46.6% |
| Canadians | 94.4 /100 | #119 | Exceptional 46.6% |
| Immigrants | Nepal | 94.1 /100 | #120 | Exceptional 46.6% |
| Scandinavians | 93.6 /100 | #121 | Exceptional 46.6% |
| Immigrants | Albania | 93.2 /100 | #122 | Exceptional 46.6% |
| Immigrants | Colombia | 92.6 /100 | #123 | Exceptional 46.7% |
| Immigrants | South America | 91.8 /100 | #124 | Exceptional 46.7% |
| Colombians | 91.3 /100 | #125 | Exceptional 46.7% |
| Europeans | 91.2 /100 | #126 | Exceptional 46.7% |
| Syrians | 91.1 /100 | #127 | Exceptional 46.7% |
| Icelanders | 90.9 /100 | #128 | Exceptional 46.7% |
| Immigrants | Germany | 90.8 /100 | #129 | Exceptional 46.7% |
| Immigrants | Northern Africa | 90.7 /100 | #130 | Exceptional 46.7% |
Demographics Similar to Nicaraguans by Disability Age Over 75
In terms of disability age over 75, the demographic groups most similar to Nicaraguans are Immigrants from Nicaragua (48.2%, a difference of 0.030%), Immigrants from St. Vincent and the Grenadines (48.2%, a difference of 0.030%), Immigrants from Thailand (48.3%, a difference of 0.040%), Subsaharan African (48.2%, a difference of 0.13%), and Hmong (48.2%, a difference of 0.13%).
| Demographics | Rating | Rank | Disability Age Over 75 |
| Immigrants | Immigrants | 4.3 /100 | #231 | Tragic 48.2% |
| Indonesians | 4.2 /100 | #232 | Tragic 48.2% |
| Cree | 4.2 /100 | #233 | Tragic 48.2% |
| Sub-Saharan Africans | 3.8 /100 | #234 | Tragic 48.2% |
| Hmong | 3.8 /100 | #235 | Tragic 48.2% |
| Immigrants | Nicaragua | 3.2 /100 | #236 | Tragic 48.2% |
| Immigrants | St. Vincent and the Grenadines | 3.2 /100 | #237 | Tragic 48.2% |
| Nicaraguans | 3.0 /100 | #238 | Tragic 48.3% |
| Immigrants | Thailand | 2.8 /100 | #239 | Tragic 48.3% |
| Tongans | 2.3 /100 | #240 | Tragic 48.3% |
| Native Hawaiians | 2.2 /100 | #241 | Tragic 48.3% |
| French American Indians | 2.2 /100 | #242 | Tragic 48.3% |
| Immigrants | Caribbean | 2.1 /100 | #243 | Tragic 48.4% |
| Afghans | 1.8 /100 | #244 | Tragic 48.4% |
| Americans | 1.7 /100 | #245 | Tragic 48.4% |