Immigrants from Colombia vs Immigrants from Micronesia Disability Age Over 75
COMPARE
Immigrants from Colombia
Immigrants from Micronesia
Disability Age Over 75
Disability Age Over 75 Comparison
Immigrants from Colombia
Immigrants from Micronesia
46.7%
DISABILITY AGE OVER 75
92.6/ 100
METRIC RATING
123rd/ 347
METRIC RANK
50.1%
DISABILITY AGE OVER 75
0.0/ 100
METRIC RATING
299th/ 347
METRIC RANK
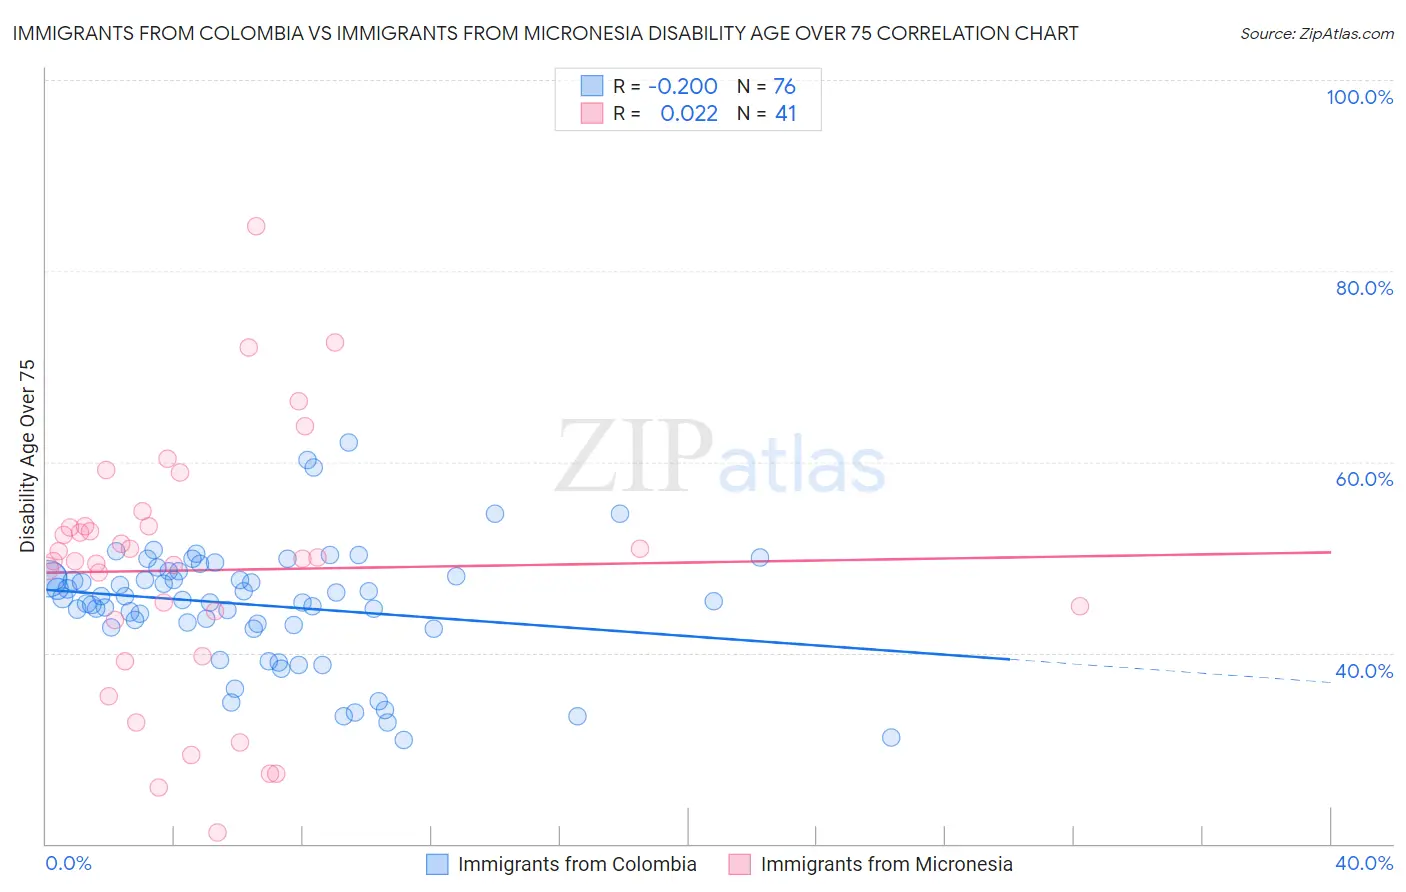
Immigrants from Colombia vs Immigrants from Micronesia Disability Age Over 75 Correlation Chart
The statistical analysis conducted on geographies consisting of 378,064,071 people shows a poor negative correlation between the proportion of Immigrants from Colombia and percentage of population with a disability over the age of 75 in the United States with a correlation coefficient (R) of -0.200 and weighted average of 46.7%. Similarly, the statistical analysis conducted on geographies consisting of 61,409,070 people shows no correlation between the proportion of Immigrants from Micronesia and percentage of population with a disability over the age of 75 in the United States with a correlation coefficient (R) of 0.022 and weighted average of 50.1%, a difference of 7.3%.
Disability Age Over 75 Correlation Summary
| Measurement | Immigrants from Colombia | Immigrants from Micronesia |
| Minimum | 30.8% | 21.2% |
| Maximum | 62.0% | 84.7% |
| Range | 31.2% | 63.5% |
| Mean | 45.0% | 48.7% |
| Median | 45.6% | 49.9% |
| Interquartile 25% (IQ1) | 42.8% | 41.5% |
| Interquartile 75% (IQ3) | 48.3% | 53.2% |
| Interquartile Range (IQR) | 5.5% | 11.7% |
| Standard Deviation (Sample) | 6.2% | 13.3% |
| Standard Deviation (Population) | 6.2% | 13.1% |
Similar Demographics by Disability Age Over 75
Demographics Similar to Immigrants from Colombia by Disability Age Over 75
In terms of disability age over 75, the demographic groups most similar to Immigrants from Colombia are Immigrants from Albania (46.6%, a difference of 0.050%), Immigrants from South America (46.7%, a difference of 0.060%), Colombian (46.7%, a difference of 0.090%), Scandinavian (46.6%, a difference of 0.10%), and European (46.7%, a difference of 0.10%).
| Demographics | Rating | Rank | Disability Age Over 75 |
| Indians (Asian) | 95.7 /100 | #116 | Exceptional 46.5% |
| Hungarians | 95.3 /100 | #117 | Exceptional 46.5% |
| Czechoslovakians | 94.7 /100 | #118 | Exceptional 46.6% |
| Canadians | 94.4 /100 | #119 | Exceptional 46.6% |
| Immigrants | Nepal | 94.1 /100 | #120 | Exceptional 46.6% |
| Scandinavians | 93.6 /100 | #121 | Exceptional 46.6% |
| Immigrants | Albania | 93.2 /100 | #122 | Exceptional 46.6% |
| Immigrants | Colombia | 92.6 /100 | #123 | Exceptional 46.7% |
| Immigrants | South America | 91.8 /100 | #124 | Exceptional 46.7% |
| Colombians | 91.3 /100 | #125 | Exceptional 46.7% |
| Europeans | 91.2 /100 | #126 | Exceptional 46.7% |
| Syrians | 91.1 /100 | #127 | Exceptional 46.7% |
| Icelanders | 90.9 /100 | #128 | Exceptional 46.7% |
| Immigrants | Germany | 90.8 /100 | #129 | Exceptional 46.7% |
| Immigrants | Northern Africa | 90.7 /100 | #130 | Exceptional 46.7% |
Demographics Similar to Immigrants from Micronesia by Disability Age Over 75
In terms of disability age over 75, the demographic groups most similar to Immigrants from Micronesia are Cape Verdean (50.1%, a difference of 0.040%), Marshallese (50.1%, a difference of 0.070%), Dominican (50.2%, a difference of 0.090%), Armenian (50.0%, a difference of 0.12%), and Mexican American Indian (50.0%, a difference of 0.15%).
| Demographics | Rating | Rank | Disability Age Over 75 |
| Shoshone | 0.0 /100 | #292 | Tragic 49.9% |
| Spanish American Indians | 0.0 /100 | #293 | Tragic 49.9% |
| Immigrants | Cambodia | 0.0 /100 | #294 | Tragic 50.0% |
| Spanish Americans | 0.0 /100 | #295 | Tragic 50.0% |
| Mexican American Indians | 0.0 /100 | #296 | Tragic 50.0% |
| Armenians | 0.0 /100 | #297 | Tragic 50.0% |
| Marshallese | 0.0 /100 | #298 | Tragic 50.1% |
| Immigrants | Micronesia | 0.0 /100 | #299 | Tragic 50.1% |
| Cape Verdeans | 0.0 /100 | #300 | Tragic 50.1% |
| Dominicans | 0.0 /100 | #301 | Tragic 50.2% |
| Cherokee | 0.0 /100 | #302 | Tragic 50.2% |
| Japanese | 0.0 /100 | #303 | Tragic 50.2% |
| Immigrants | Dominican Republic | 0.0 /100 | #304 | Tragic 50.3% |
| Central American Indians | 0.0 /100 | #305 | Tragic 50.5% |
| Immigrants | Central America | 0.0 /100 | #306 | Tragic 50.5% |