Paiute vs Immigrants from Mexico Disability Age Under 5
COMPARE
Paiute
Immigrants from Mexico
Disability Age Under 5
Disability Age Under 5 Comparison
Paiute
Immigrants from Mexico
3.9%
DISABILITY AGE UNDER 5
0.0/ 100
METRIC RATING
345th/ 347
METRIC RANK
1.2%
DISABILITY AGE UNDER 5
44.4/ 100
METRIC RATING
180th/ 347
METRIC RANK
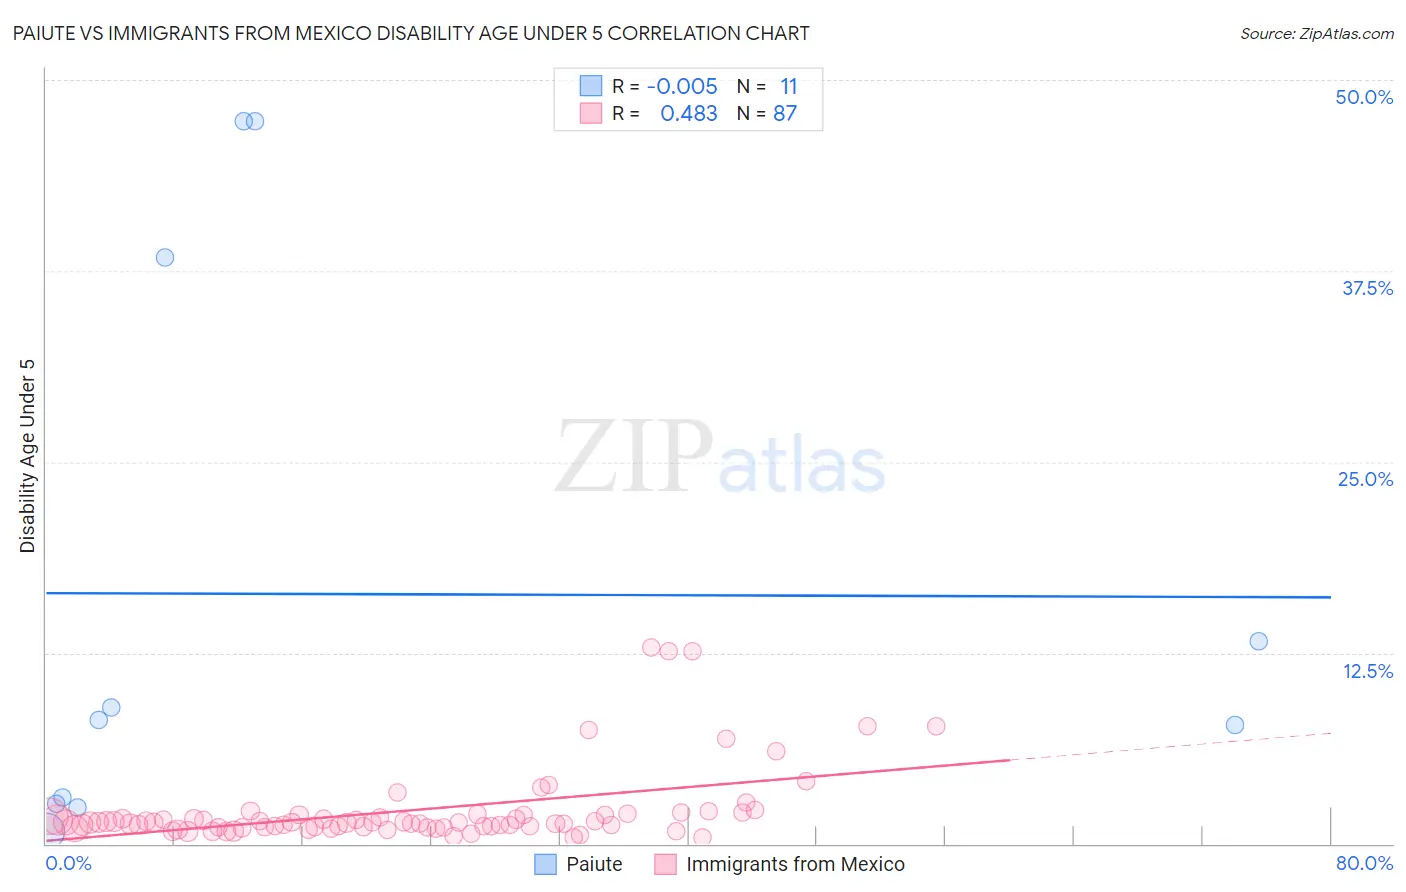
Paiute vs Immigrants from Mexico Disability Age Under 5 Correlation Chart
The statistical analysis conducted on geographies consisting of 49,758,622 people shows no correlation between the proportion of Paiute and percentage of population with a disability under the age of 5 in the United States with a correlation coefficient (R) of -0.005 and weighted average of 3.9%. Similarly, the statistical analysis conducted on geographies consisting of 251,023,549 people shows a moderate positive correlation between the proportion of Immigrants from Mexico and percentage of population with a disability under the age of 5 in the United States with a correlation coefficient (R) of 0.483 and weighted average of 1.2%, a difference of 213.6%.
Disability Age Under 5 Correlation Summary
| Measurement | Paiute | Immigrants from Mexico |
| Minimum | 0.83% | 0.38% |
| Maximum | 47.3% | 12.8% |
| Range | 46.5% | 12.4% |
| Mean | 16.3% | 2.2% |
| Median | 8.1% | 1.4% |
| Interquartile 25% (IQ1) | 2.6% | 1.1% |
| Interquartile 75% (IQ3) | 38.4% | 1.9% |
| Interquartile Range (IQR) | 35.7% | 0.79% |
| Standard Deviation (Sample) | 18.5% | 2.5% |
| Standard Deviation (Population) | 17.6% | 2.5% |
Similar Demographics by Disability Age Under 5
Demographics Similar to Paiute by Disability Age Under 5
In terms of disability age under 5, the demographic groups most similar to Paiute are Inupiat (3.7%, a difference of 5.3%), Yup'ik (4.5%, a difference of 15.8%), Hopi (4.6%, a difference of 18.4%), Colville (3.3%, a difference of 19.0%), and Alaska Native (2.9%, a difference of 32.9%).
| Demographics | Rating | Rank | Disability Age Under 5 |
| Dutch West Indians | 0.0 /100 | #333 | Tragic 1.9% |
| Natives/Alaskans | 0.0 /100 | #334 | Tragic 1.9% |
| Pennsylvania Germans | 0.0 /100 | #335 | Tragic 1.9% |
| Paraguayans | 0.0 /100 | #336 | Tragic 2.0% |
| Apache | 0.0 /100 | #337 | Tragic 2.0% |
| Tohono O'odham | 0.0 /100 | #338 | Tragic 2.2% |
| Immigrants | Azores | 0.0 /100 | #339 | Tragic 2.2% |
| Menominee | 0.0 /100 | #340 | Tragic 2.3% |
| Tsimshian | 0.0 /100 | #341 | Tragic 2.4% |
| Alaska Natives | 0.0 /100 | #342 | Tragic 2.9% |
| Colville | 0.0 /100 | #343 | Tragic 3.3% |
| Inupiat | 0.0 /100 | #344 | Tragic 3.7% |
| Paiute | 0.0 /100 | #345 | Tragic 3.9% |
| Yup'ik | 0.0 /100 | #346 | Tragic 4.5% |
| Hopi | 0.0 /100 | #347 | Tragic 4.6% |
Demographics Similar to Immigrants from Mexico by Disability Age Under 5
In terms of disability age under 5, the demographic groups most similar to Immigrants from Mexico are Immigrants from Bahamas (1.2%, a difference of 0.070%), Macedonian (1.2%, a difference of 0.070%), Immigrants from Peru (1.2%, a difference of 0.070%), Immigrants from Saudi Arabia (1.2%, a difference of 0.10%), and Palestinian (1.2%, a difference of 0.13%).
| Demographics | Rating | Rank | Disability Age Under 5 |
| Immigrants | Ireland | 50.3 /100 | #173 | Average 1.2% |
| Immigrants | Latvia | 50.0 /100 | #174 | Average 1.2% |
| Immigrants | Nigeria | 50.0 /100 | #175 | Average 1.2% |
| Immigrants | Kenya | 48.6 /100 | #176 | Average 1.2% |
| Comanche | 47.5 /100 | #177 | Average 1.2% |
| Venezuelans | 47.1 /100 | #178 | Average 1.2% |
| Immigrants | Bahamas | 45.2 /100 | #179 | Average 1.2% |
| Immigrants | Mexico | 44.4 /100 | #180 | Average 1.2% |
| Macedonians | 43.7 /100 | #181 | Average 1.2% |
| Immigrants | Peru | 43.7 /100 | #181 | Average 1.2% |
| Immigrants | Saudi Arabia | 43.3 /100 | #183 | Average 1.2% |
| Palestinians | 43.0 /100 | #184 | Average 1.2% |
| Immigrants | Western Africa | 42.5 /100 | #185 | Average 1.2% |
| Cubans | 42.5 /100 | #186 | Average 1.2% |
| Immigrants | Haiti | 40.2 /100 | #187 | Average 1.3% |