Immigrants from Central America vs Immigrants from Bulgaria Hearing Disability
COMPARE
Immigrants from Central America
Immigrants from Bulgaria
Hearing Disability
Hearing Disability Comparison
Immigrants from Central America
Immigrants from Bulgaria
3.0%
HEARING DISABILITY
64.9/ 100
METRIC RATING
163rd/ 347
METRIC RANK
2.9%
HEARING DISABILITY
79.2/ 100
METRIC RATING
144th/ 347
METRIC RANK
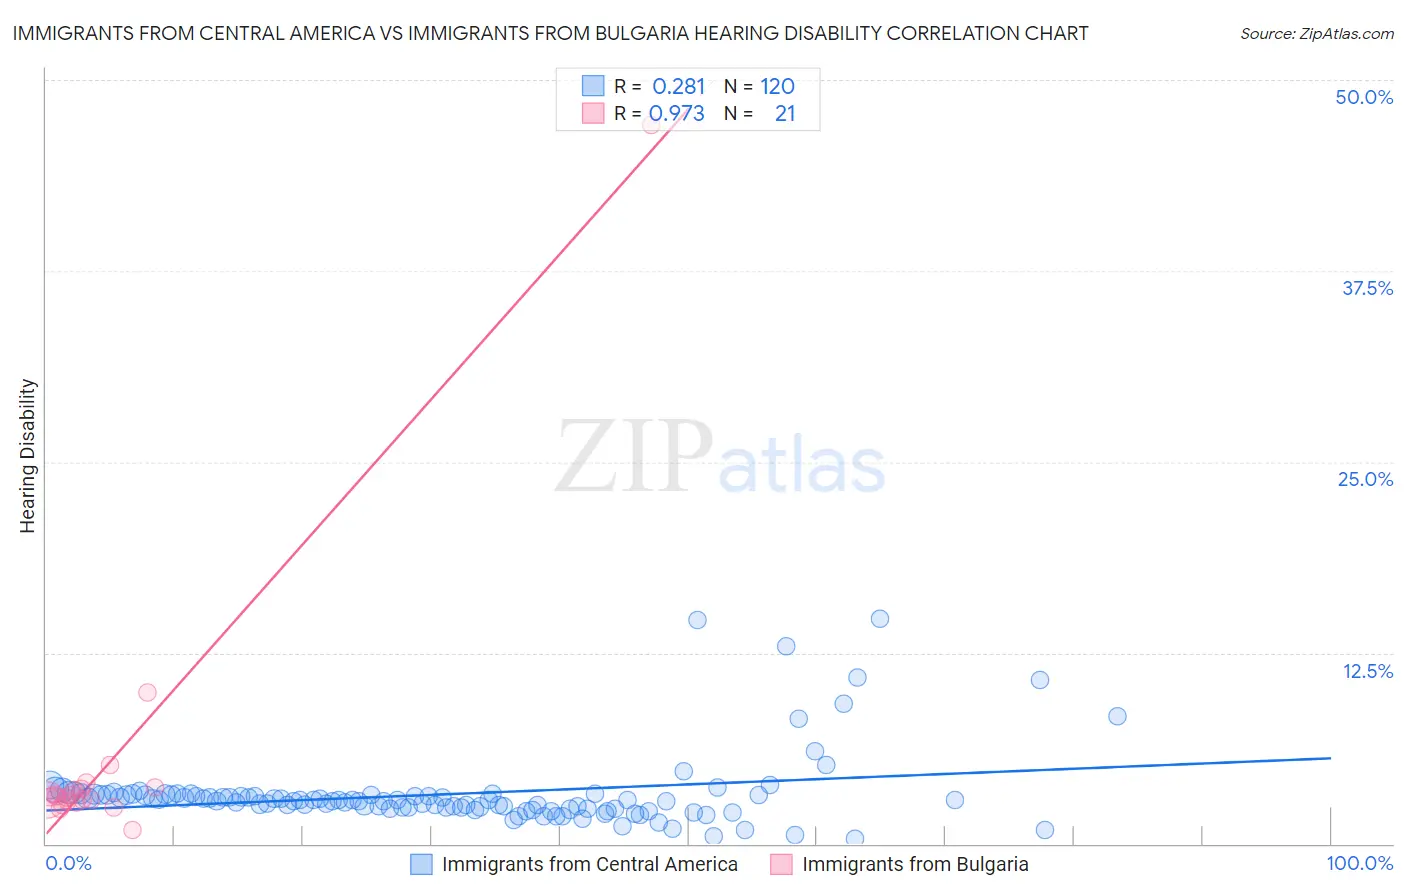
Immigrants from Central America vs Immigrants from Bulgaria Hearing Disability Correlation Chart
The statistical analysis conducted on geographies consisting of 535,995,824 people shows a weak positive correlation between the proportion of Immigrants from Central America and percentage of population with hearing disability in the United States with a correlation coefficient (R) of 0.281 and weighted average of 3.0%. Similarly, the statistical analysis conducted on geographies consisting of 172,536,031 people shows a perfect positive correlation between the proportion of Immigrants from Bulgaria and percentage of population with hearing disability in the United States with a correlation coefficient (R) of 0.973 and weighted average of 2.9%, a difference of 1.7%.
Hearing Disability Correlation Summary
| Measurement | Immigrants from Central America | Immigrants from Bulgaria |
| Minimum | 0.32% | 0.89% |
| Maximum | 14.7% | 47.1% |
| Range | 14.4% | 46.2% |
| Mean | 3.2% | 5.5% |
| Median | 2.8% | 3.1% |
| Interquartile 25% (IQ1) | 2.3% | 2.8% |
| Interquartile 75% (IQ3) | 3.2% | 3.6% |
| Interquartile Range (IQR) | 0.87% | 0.89% |
| Standard Deviation (Sample) | 2.4% | 9.7% |
| Standard Deviation (Population) | 2.4% | 9.4% |
Demographics Similar to Immigrants from Central America and Immigrants from Bulgaria by Hearing Disability
In terms of hearing disability, the demographic groups most similar to Immigrants from Central America are Immigrants from Japan (2.9%, a difference of 0.15%), Albanian (2.9%, a difference of 0.17%), Immigrants from Fiji (2.9%, a difference of 0.24%), Immigrants from Australia (2.9%, a difference of 0.26%), and Immigrants from Burma/Myanmar (2.9%, a difference of 0.50%). Similarly, the demographic groups most similar to Immigrants from Bulgaria are Immigrants from Congo (2.9%, a difference of 0.050%), Brazilian (2.9%, a difference of 0.070%), Tongan (2.9%, a difference of 0.080%), Immigrants from Russia (2.9%, a difference of 0.21%), and Immigrants from Bahamas (2.9%, a difference of 0.27%).
| Demographics | Rating | Rank | Hearing Disability |
| Immigrants | Bahamas | 80.9 /100 | #143 | Excellent 2.9% |
| Immigrants | Bulgaria | 79.2 /100 | #144 | Good 2.9% |
| Immigrants | Congo | 78.9 /100 | #145 | Good 2.9% |
| Brazilians | 78.7 /100 | #146 | Good 2.9% |
| Tongans | 78.6 /100 | #147 | Good 2.9% |
| Immigrants | Russia | 77.7 /100 | #148 | Good 2.9% |
| Immigrants | Panama | 76.9 /100 | #149 | Good 2.9% |
| Palestinians | 73.6 /100 | #150 | Good 2.9% |
| Immigrants | France | 73.1 /100 | #151 | Good 2.9% |
| Immigrants | Lithuania | 73.0 /100 | #152 | Good 2.9% |
| Sudanese | 72.1 /100 | #153 | Good 2.9% |
| Immigrants | Lebanon | 71.5 /100 | #154 | Good 2.9% |
| Costa Ricans | 71.4 /100 | #155 | Good 2.9% |
| Immigrants | Poland | 70.2 /100 | #156 | Good 2.9% |
| Immigrants | Kazakhstan | 69.6 /100 | #157 | Good 2.9% |
| Immigrants | Burma/Myanmar | 69.5 /100 | #158 | Good 2.9% |
| Immigrants | Australia | 67.4 /100 | #159 | Good 2.9% |
| Immigrants | Fiji | 67.1 /100 | #160 | Good 2.9% |
| Albanians | 66.6 /100 | #161 | Good 2.9% |
| Immigrants | Japan | 66.3 /100 | #162 | Good 2.9% |
| Immigrants | Central America | 64.9 /100 | #163 | Good 3.0% |