Immigrants from Mexico vs Immigrants from Bulgaria Hearing Disability
COMPARE
Immigrants from Mexico
Immigrants from Bulgaria
Hearing Disability
Hearing Disability Comparison
Immigrants from Mexico
Immigrants from Bulgaria
3.0%
HEARING DISABILITY
34.9/ 100
METRIC RATING
186th/ 347
METRIC RANK
2.9%
HEARING DISABILITY
79.2/ 100
METRIC RATING
144th/ 347
METRIC RANK
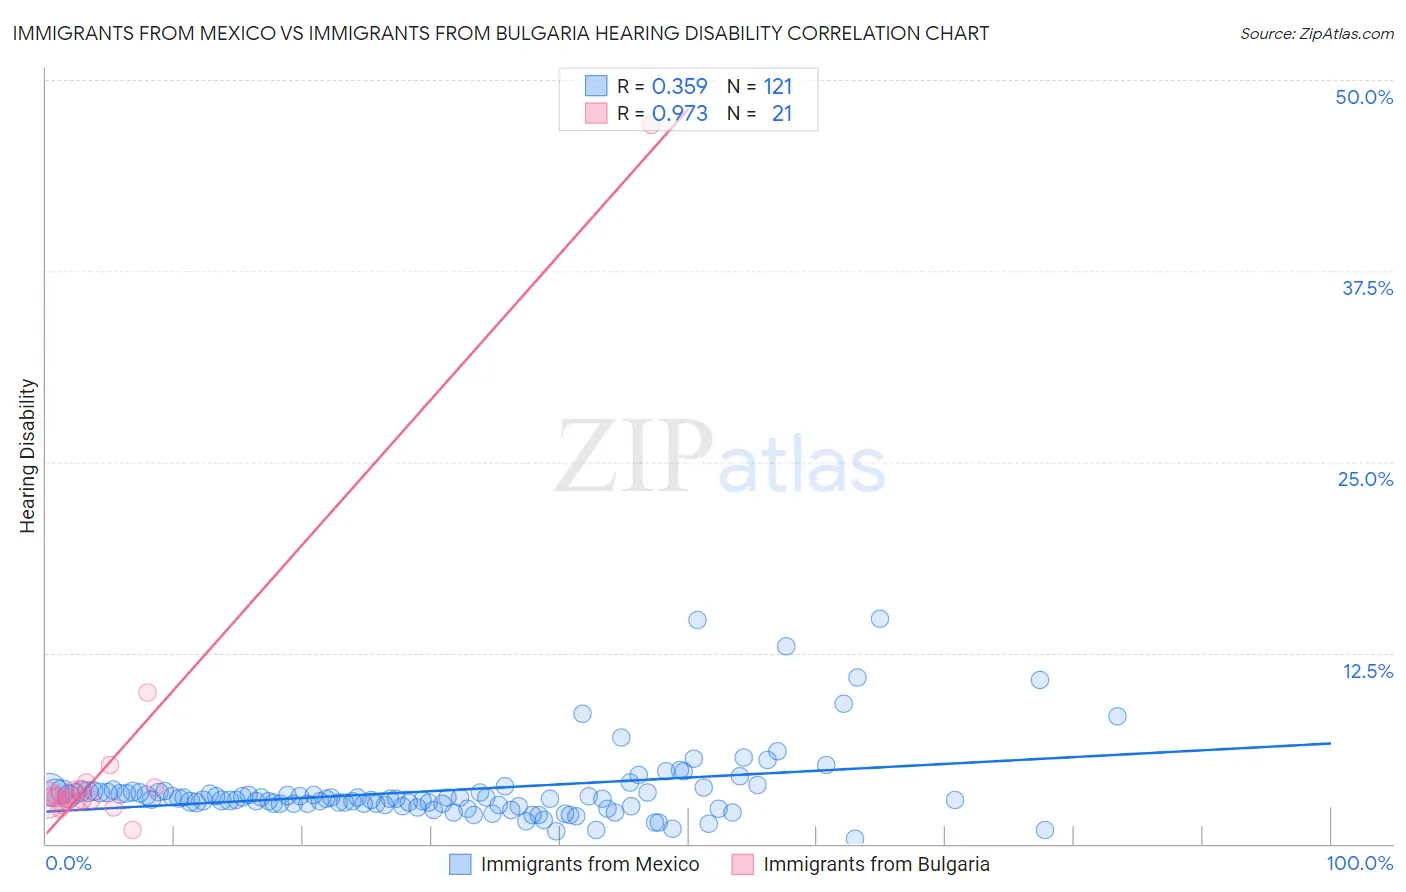
Immigrants from Mexico vs Immigrants from Bulgaria Hearing Disability Correlation Chart
The statistical analysis conducted on geographies consisting of 513,280,828 people shows a mild positive correlation between the proportion of Immigrants from Mexico and percentage of population with hearing disability in the United States with a correlation coefficient (R) of 0.359 and weighted average of 3.0%. Similarly, the statistical analysis conducted on geographies consisting of 172,536,031 people shows a perfect positive correlation between the proportion of Immigrants from Bulgaria and percentage of population with hearing disability in the United States with a correlation coefficient (R) of 0.973 and weighted average of 2.9%, a difference of 4.8%.
Hearing Disability Correlation Summary
| Measurement | Immigrants from Mexico | Immigrants from Bulgaria |
| Minimum | 0.32% | 0.89% |
| Maximum | 14.7% | 47.1% |
| Range | 14.4% | 46.2% |
| Mean | 3.5% | 5.5% |
| Median | 3.0% | 3.1% |
| Interquartile 25% (IQ1) | 2.5% | 2.8% |
| Interquartile 75% (IQ3) | 3.4% | 3.6% |
| Interquartile Range (IQR) | 0.88% | 0.89% |
| Standard Deviation (Sample) | 2.4% | 9.7% |
| Standard Deviation (Population) | 2.4% | 9.4% |
Similar Demographics by Hearing Disability
Demographics Similar to Immigrants from Mexico by Hearing Disability
In terms of hearing disability, the demographic groups most similar to Immigrants from Mexico are Black/African American (3.0%, a difference of 0.010%), Mexican American Indian (3.0%, a difference of 0.020%), Immigrants from Southern Europe (3.0%, a difference of 0.050%), African (3.0%, a difference of 0.21%), and Immigrants from Ireland (3.0%, a difference of 0.25%).
| Demographics | Rating | Rank | Hearing Disability |
| Immigrants | Moldova | 43.1 /100 | #179 | Average 3.0% |
| Immigrants | Sweden | 42.4 /100 | #180 | Average 3.0% |
| Immigrants | Belgium | 41.5 /100 | #181 | Average 3.0% |
| Immigrants | Italy | 41.1 /100 | #182 | Average 3.0% |
| Bulgarians | 39.7 /100 | #183 | Fair 3.0% |
| Immigrants | Ireland | 37.4 /100 | #184 | Fair 3.0% |
| Immigrants | Southern Europe | 35.3 /100 | #185 | Fair 3.0% |
| Immigrants | Mexico | 34.9 /100 | #186 | Fair 3.0% |
| Blacks/African Americans | 34.7 /100 | #187 | Fair 3.0% |
| Mexican American Indians | 34.7 /100 | #188 | Fair 3.0% |
| Africans | 32.9 /100 | #189 | Fair 3.0% |
| Immigrants | South Africa | 31.1 /100 | #190 | Fair 3.1% |
| Immigrants | Switzerland | 28.8 /100 | #191 | Fair 3.1% |
| Koreans | 27.6 /100 | #192 | Fair 3.1% |
| Macedonians | 27.0 /100 | #193 | Fair 3.1% |
Demographics Similar to Immigrants from Bulgaria by Hearing Disability
In terms of hearing disability, the demographic groups most similar to Immigrants from Bulgaria are Immigrants from Congo (2.9%, a difference of 0.050%), Brazilian (2.9%, a difference of 0.070%), Tongan (2.9%, a difference of 0.080%), Immigrants from Russia (2.9%, a difference of 0.21%), and Immigrants from Bahamas (2.9%, a difference of 0.27%).
| Demographics | Rating | Rank | Hearing Disability |
| Sri Lankans | 84.1 /100 | #137 | Excellent 2.9% |
| Immigrants | Costa Rica | 84.0 /100 | #138 | Excellent 2.9% |
| Bermudans | 83.8 /100 | #139 | Excellent 2.9% |
| Immigrants | Jordan | 83.7 /100 | #140 | Excellent 2.9% |
| Sub-Saharan Africans | 83.3 /100 | #141 | Excellent 2.9% |
| Laotians | 81.1 /100 | #142 | Excellent 2.9% |
| Immigrants | Bahamas | 80.9 /100 | #143 | Excellent 2.9% |
| Immigrants | Bulgaria | 79.2 /100 | #144 | Good 2.9% |
| Immigrants | Congo | 78.9 /100 | #145 | Good 2.9% |
| Brazilians | 78.7 /100 | #146 | Good 2.9% |
| Tongans | 78.6 /100 | #147 | Good 2.9% |
| Immigrants | Russia | 77.7 /100 | #148 | Good 2.9% |
| Immigrants | Panama | 76.9 /100 | #149 | Good 2.9% |
| Palestinians | 73.6 /100 | #150 | Good 2.9% |
| Immigrants | France | 73.1 /100 | #151 | Good 2.9% |