Immigrants from Central America vs Nonimmigrants Hearing Disability
COMPARE
Immigrants from Central America
Nonimmigrants
Hearing Disability
Hearing Disability Comparison
Immigrants from Central America
Nonimmigrants
3.0%
HEARING DISABILITY
64.9/ 100
METRIC RATING
163rd/ 347
METRIC RANK
3.6%
HEARING DISABILITY
0.0/ 100
METRIC RATING
277th/ 347
METRIC RANK
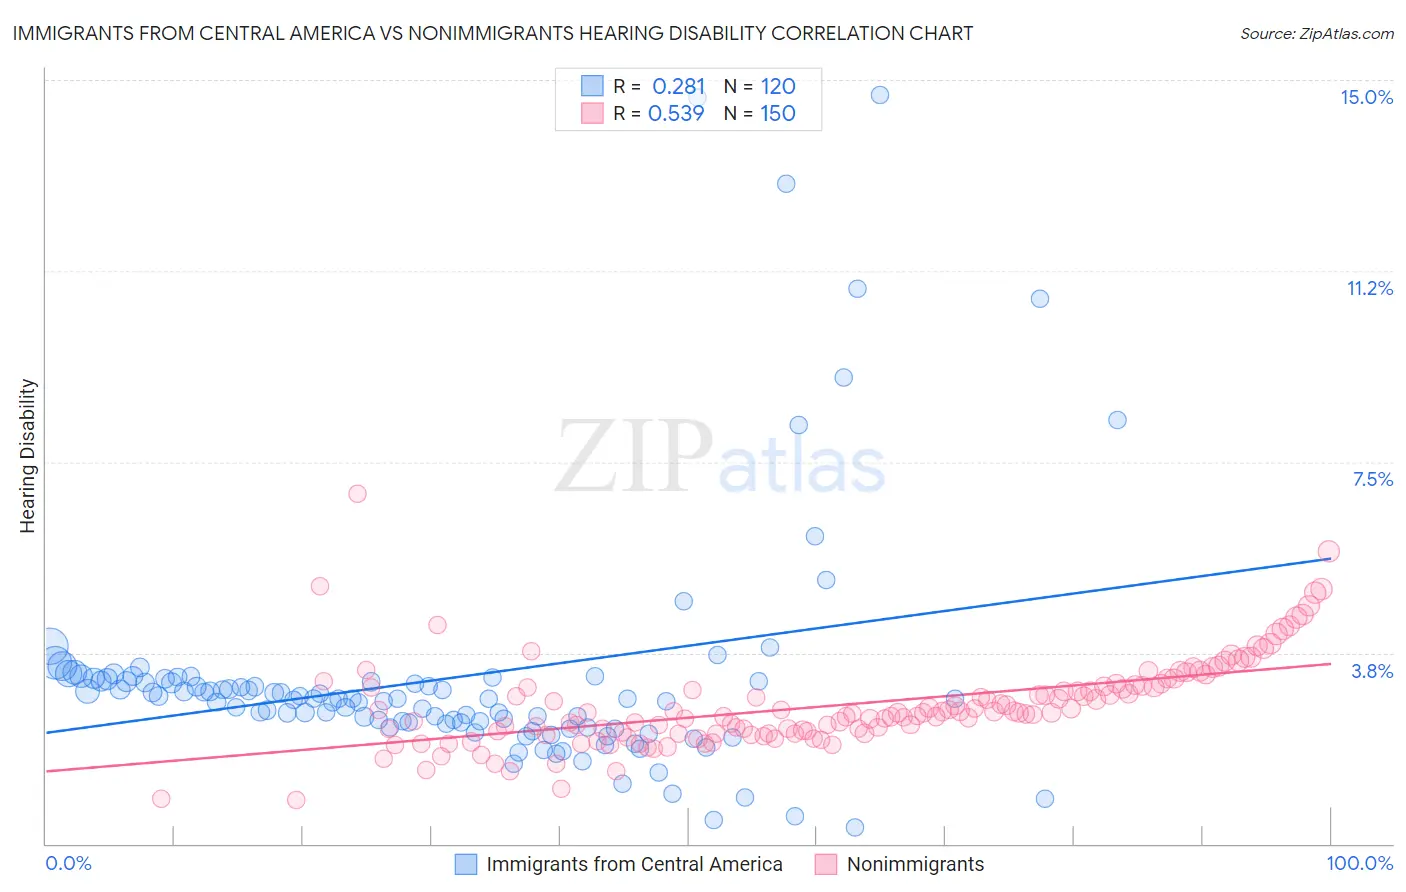
Immigrants from Central America vs Nonimmigrants Hearing Disability Correlation Chart
The statistical analysis conducted on geographies consisting of 535,995,824 people shows a weak positive correlation between the proportion of Immigrants from Central America and percentage of population with hearing disability in the United States with a correlation coefficient (R) of 0.281 and weighted average of 3.0%. Similarly, the statistical analysis conducted on geographies consisting of 583,885,168 people shows a substantial positive correlation between the proportion of Nonimmigrants and percentage of population with hearing disability in the United States with a correlation coefficient (R) of 0.539 and weighted average of 3.6%, a difference of 21.3%.
Hearing Disability Correlation Summary
| Measurement | Immigrants from Central America | Nonimmigrants |
| Minimum | 0.32% | 0.87% |
| Maximum | 14.7% | 6.9% |
| Range | 14.4% | 6.0% |
| Mean | 3.2% | 2.7% |
| Median | 2.8% | 2.6% |
| Interquartile 25% (IQ1) | 2.3% | 2.2% |
| Interquartile 75% (IQ3) | 3.2% | 3.1% |
| Interquartile Range (IQR) | 0.87% | 0.92% |
| Standard Deviation (Sample) | 2.4% | 0.88% |
| Standard Deviation (Population) | 2.4% | 0.88% |
Similar Demographics by Hearing Disability
Demographics Similar to Immigrants from Central America by Hearing Disability
In terms of hearing disability, the demographic groups most similar to Immigrants from Central America are Immigrants from Cambodia (3.0%, a difference of 0.020%), Immigrants from Zimbabwe (3.0%, a difference of 0.080%), Immigrants from Japan (2.9%, a difference of 0.15%), Albanian (2.9%, a difference of 0.17%), and Immigrants from South Eastern Asia (3.0%, a difference of 0.21%).
| Demographics | Rating | Rank | Hearing Disability |
| Immigrants | Poland | 70.2 /100 | #156 | Good 2.9% |
| Immigrants | Kazakhstan | 69.6 /100 | #157 | Good 2.9% |
| Immigrants | Burma/Myanmar | 69.5 /100 | #158 | Good 2.9% |
| Immigrants | Australia | 67.4 /100 | #159 | Good 2.9% |
| Immigrants | Fiji | 67.1 /100 | #160 | Good 2.9% |
| Albanians | 66.6 /100 | #161 | Good 2.9% |
| Immigrants | Japan | 66.3 /100 | #162 | Good 2.9% |
| Immigrants | Central America | 64.9 /100 | #163 | Good 3.0% |
| Immigrants | Cambodia | 64.8 /100 | #164 | Good 3.0% |
| Immigrants | Zimbabwe | 64.2 /100 | #165 | Good 3.0% |
| Immigrants | South Eastern Asia | 62.9 /100 | #166 | Good 3.0% |
| Immigrants | Eastern Europe | 58.1 /100 | #167 | Average 3.0% |
| Immigrants | Greece | 57.9 /100 | #168 | Average 3.0% |
| Arabs | 57.6 /100 | #169 | Average 3.0% |
| Immigrants | Cabo Verde | 56.9 /100 | #170 | Average 3.0% |
Demographics Similar to Nonimmigrants by Hearing Disability
In terms of hearing disability, the demographic groups most similar to Nonimmigrants are Basque (3.6%, a difference of 0.39%), Slovak (3.6%, a difference of 0.65%), Danish (3.6%, a difference of 0.70%), French American Indian (3.6%, a difference of 0.72%), and Scandinavian (3.6%, a difference of 0.78%).
| Demographics | Rating | Rank | Hearing Disability |
| Europeans | 0.1 /100 | #270 | Tragic 3.5% |
| Czechs | 0.1 /100 | #271 | Tragic 3.5% |
| Fijians | 0.0 /100 | #272 | Tragic 3.5% |
| Puerto Ricans | 0.0 /100 | #273 | Tragic 3.5% |
| Swiss | 0.0 /100 | #274 | Tragic 3.5% |
| Czechoslovakians | 0.0 /100 | #275 | Tragic 3.6% |
| Danes | 0.0 /100 | #276 | Tragic 3.6% |
| Immigrants | Nonimmigrants | 0.0 /100 | #277 | Tragic 3.6% |
| Basques | 0.0 /100 | #278 | Tragic 3.6% |
| Slovaks | 0.0 /100 | #279 | Tragic 3.6% |
| French American Indians | 0.0 /100 | #280 | Tragic 3.6% |
| Scandinavians | 0.0 /100 | #281 | Tragic 3.6% |
| Swedes | 0.0 /100 | #282 | Tragic 3.6% |
| Blackfeet | 0.0 /100 | #283 | Tragic 3.6% |
| Immigrants | Micronesia | 0.0 /100 | #284 | Tragic 3.6% |