Carpatho Rusyn vs Immigrants from Bulgaria Hearing Disability
COMPARE
Carpatho Rusyn
Immigrants from Bulgaria
Hearing Disability
Hearing Disability Comparison
Carpatho Rusyns
Immigrants from Bulgaria
3.4%
HEARING DISABILITY
0.3/ 100
METRIC RATING
253rd/ 347
METRIC RANK
2.9%
HEARING DISABILITY
79.2/ 100
METRIC RATING
144th/ 347
METRIC RANK
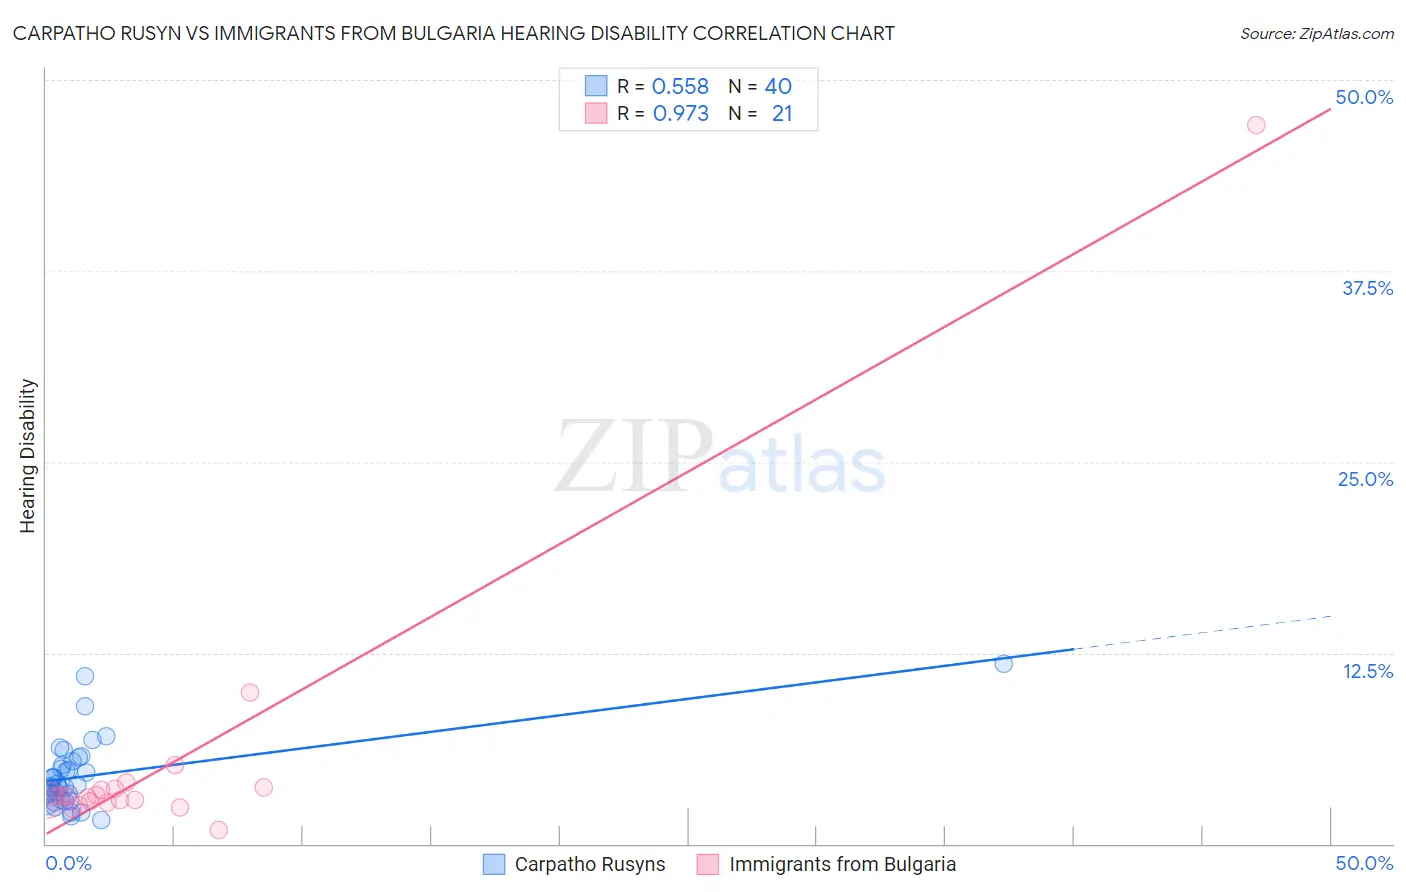
Carpatho Rusyn vs Immigrants from Bulgaria Hearing Disability Correlation Chart
The statistical analysis conducted on geographies consisting of 58,869,507 people shows a substantial positive correlation between the proportion of Carpatho Rusyns and percentage of population with hearing disability in the United States with a correlation coefficient (R) of 0.558 and weighted average of 3.4%. Similarly, the statistical analysis conducted on geographies consisting of 172,536,031 people shows a perfect positive correlation between the proportion of Immigrants from Bulgaria and percentage of population with hearing disability in the United States with a correlation coefficient (R) of 0.973 and weighted average of 2.9%, a difference of 17.4%.
Hearing Disability Correlation Summary
| Measurement | Carpatho Rusyn | Immigrants from Bulgaria |
| Minimum | 1.5% | 0.89% |
| Maximum | 11.8% | 47.1% |
| Range | 10.2% | 46.2% |
| Mean | 4.5% | 5.5% |
| Median | 3.8% | 3.1% |
| Interquartile 25% (IQ1) | 3.0% | 2.8% |
| Interquartile 75% (IQ3) | 5.3% | 3.6% |
| Interquartile Range (IQR) | 2.3% | 0.89% |
| Standard Deviation (Sample) | 2.2% | 9.7% |
| Standard Deviation (Population) | 2.2% | 9.4% |
Similar Demographics by Hearing Disability
Demographics Similar to Carpatho Rusyns by Hearing Disability
In terms of hearing disability, the demographic groups most similar to Carpatho Rusyns are Slavic (3.4%, a difference of 0.42%), Croatian (3.4%, a difference of 0.45%), Polish (3.4%, a difference of 0.65%), Hungarian (3.4%, a difference of 0.66%), and Hmong (3.4%, a difference of 0.70%).
| Demographics | Rating | Rank | Hearing Disability |
| Immigrants | England | 0.7 /100 | #246 | Tragic 3.3% |
| Lithuanians | 0.6 /100 | #247 | Tragic 3.4% |
| Austrians | 0.6 /100 | #248 | Tragic 3.4% |
| Italians | 0.4 /100 | #249 | Tragic 3.4% |
| Yuman | 0.4 /100 | #250 | Tragic 3.4% |
| Hungarians | 0.4 /100 | #251 | Tragic 3.4% |
| Croatians | 0.4 /100 | #252 | Tragic 3.4% |
| Carpatho Rusyns | 0.3 /100 | #253 | Tragic 3.4% |
| Slavs | 0.2 /100 | #254 | Tragic 3.4% |
| Poles | 0.2 /100 | #255 | Tragic 3.4% |
| Hmong | 0.2 /100 | #256 | Tragic 3.4% |
| Yaqui | 0.2 /100 | #257 | Tragic 3.4% |
| Northern Europeans | 0.2 /100 | #258 | Tragic 3.4% |
| Slovenes | 0.1 /100 | #259 | Tragic 3.5% |
| Portuguese | 0.1 /100 | #260 | Tragic 3.5% |
Demographics Similar to Immigrants from Bulgaria by Hearing Disability
In terms of hearing disability, the demographic groups most similar to Immigrants from Bulgaria are Immigrants from Congo (2.9%, a difference of 0.050%), Brazilian (2.9%, a difference of 0.070%), Tongan (2.9%, a difference of 0.080%), Immigrants from Russia (2.9%, a difference of 0.21%), and Immigrants from Bahamas (2.9%, a difference of 0.27%).
| Demographics | Rating | Rank | Hearing Disability |
| Sri Lankans | 84.1 /100 | #137 | Excellent 2.9% |
| Immigrants | Costa Rica | 84.0 /100 | #138 | Excellent 2.9% |
| Bermudans | 83.8 /100 | #139 | Excellent 2.9% |
| Immigrants | Jordan | 83.7 /100 | #140 | Excellent 2.9% |
| Sub-Saharan Africans | 83.3 /100 | #141 | Excellent 2.9% |
| Laotians | 81.1 /100 | #142 | Excellent 2.9% |
| Immigrants | Bahamas | 80.9 /100 | #143 | Excellent 2.9% |
| Immigrants | Bulgaria | 79.2 /100 | #144 | Good 2.9% |
| Immigrants | Congo | 78.9 /100 | #145 | Good 2.9% |
| Brazilians | 78.7 /100 | #146 | Good 2.9% |
| Tongans | 78.6 /100 | #147 | Good 2.9% |
| Immigrants | Russia | 77.7 /100 | #148 | Good 2.9% |
| Immigrants | Panama | 76.9 /100 | #149 | Good 2.9% |
| Palestinians | 73.6 /100 | #150 | Good 2.9% |
| Immigrants | France | 73.1 /100 | #151 | Good 2.9% |