English vs Immigrants from Bulgaria Hearing Disability
COMPARE
English
Immigrants from Bulgaria
Hearing Disability
Hearing Disability Comparison
English
Immigrants from Bulgaria
3.8%
HEARING DISABILITY
0.0/ 100
METRIC RATING
305th/ 347
METRIC RANK
2.9%
HEARING DISABILITY
79.2/ 100
METRIC RATING
144th/ 347
METRIC RANK
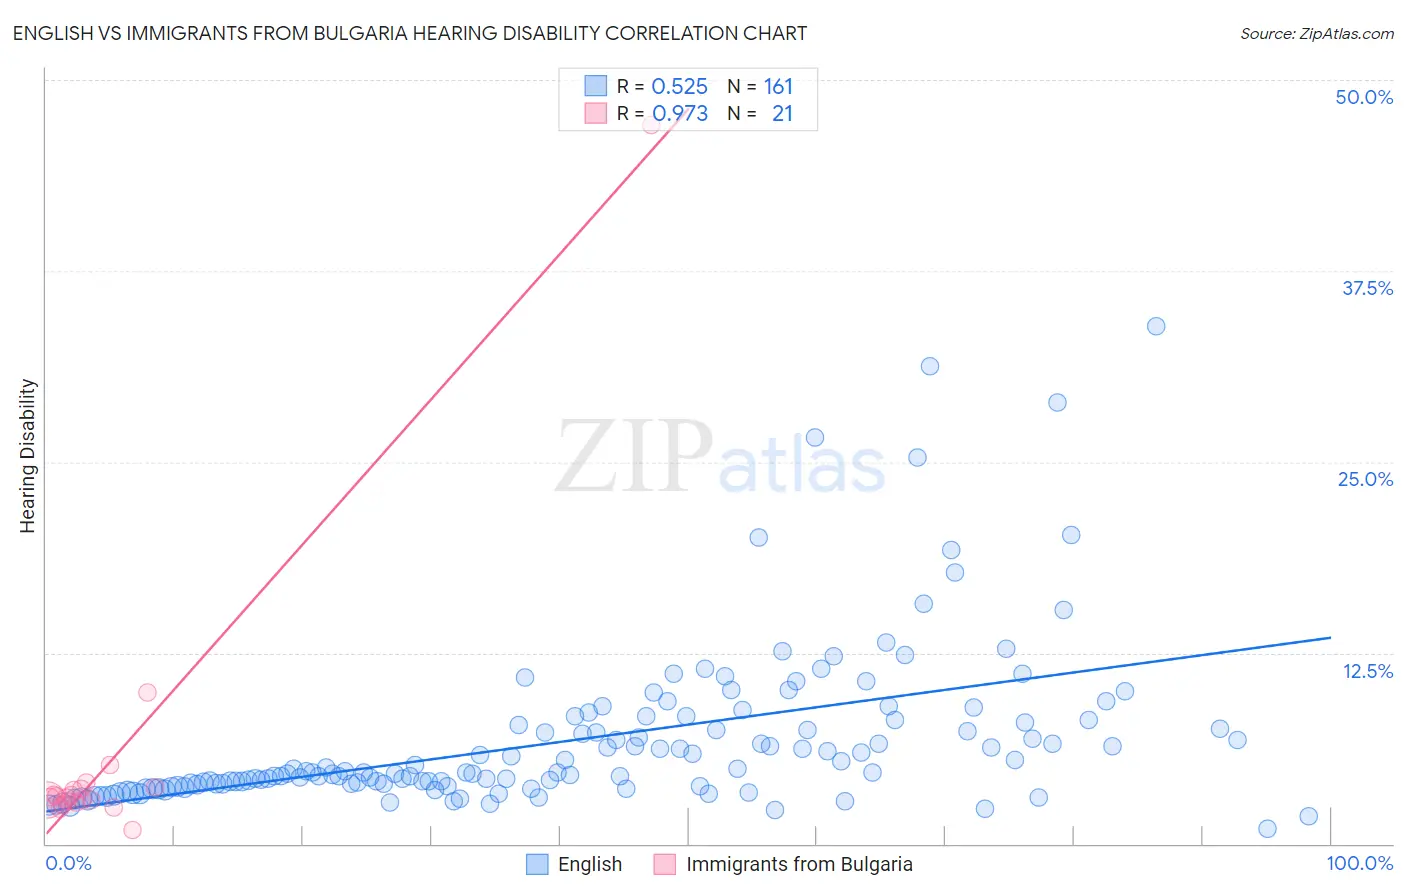
English vs Immigrants from Bulgaria Hearing Disability Correlation Chart
The statistical analysis conducted on geographies consisting of 578,898,364 people shows a substantial positive correlation between the proportion of English and percentage of population with hearing disability in the United States with a correlation coefficient (R) of 0.525 and weighted average of 3.8%. Similarly, the statistical analysis conducted on geographies consisting of 172,536,031 people shows a perfect positive correlation between the proportion of Immigrants from Bulgaria and percentage of population with hearing disability in the United States with a correlation coefficient (R) of 0.973 and weighted average of 2.9%, a difference of 30.1%.
Hearing Disability Correlation Summary
| Measurement | English | Immigrants from Bulgaria |
| Minimum | 1.0% | 0.89% |
| Maximum | 33.9% | 47.1% |
| Range | 32.9% | 46.2% |
| Mean | 6.8% | 5.5% |
| Median | 4.7% | 3.1% |
| Interquartile 25% (IQ1) | 3.8% | 2.8% |
| Interquartile 75% (IQ3) | 8.0% | 3.6% |
| Interquartile Range (IQR) | 4.2% | 0.89% |
| Standard Deviation (Sample) | 5.4% | 9.7% |
| Standard Deviation (Population) | 5.4% | 9.4% |
Similar Demographics by Hearing Disability
Demographics Similar to English by Hearing Disability
In terms of hearing disability, the demographic groups most similar to English are French (3.8%, a difference of 0.57%), Marshallese (3.8%, a difference of 0.86%), Menominee (3.7%, a difference of 0.87%), Dutch (3.7%, a difference of 0.93%), and French Canadian (3.8%, a difference of 0.98%).
| Demographics | Rating | Rank | Hearing Disability |
| Celtics | 0.0 /100 | #298 | Tragic 3.7% |
| Germans | 0.0 /100 | #299 | Tragic 3.7% |
| Scottish | 0.0 /100 | #300 | Tragic 3.7% |
| Pennsylvania Germans | 0.0 /100 | #301 | Tragic 3.7% |
| Dutch | 0.0 /100 | #302 | Tragic 3.7% |
| Menominee | 0.0 /100 | #303 | Tragic 3.7% |
| French | 0.0 /100 | #304 | Tragic 3.8% |
| English | 0.0 /100 | #305 | Tragic 3.8% |
| Marshallese | 0.0 /100 | #306 | Tragic 3.8% |
| French Canadians | 0.0 /100 | #307 | Tragic 3.8% |
| Ottawa | 0.0 /100 | #308 | Tragic 3.8% |
| Scotch-Irish | 0.0 /100 | #309 | Tragic 3.8% |
| Cree | 0.0 /100 | #310 | Tragic 3.8% |
| Americans | 0.0 /100 | #311 | Tragic 3.9% |
| Cajuns | 0.0 /100 | #312 | Tragic 3.9% |
Demographics Similar to Immigrants from Bulgaria by Hearing Disability
In terms of hearing disability, the demographic groups most similar to Immigrants from Bulgaria are Immigrants from Congo (2.9%, a difference of 0.050%), Brazilian (2.9%, a difference of 0.070%), Tongan (2.9%, a difference of 0.080%), Immigrants from Russia (2.9%, a difference of 0.21%), and Immigrants from Bahamas (2.9%, a difference of 0.27%).
| Demographics | Rating | Rank | Hearing Disability |
| Sri Lankans | 84.1 /100 | #137 | Excellent 2.9% |
| Immigrants | Costa Rica | 84.0 /100 | #138 | Excellent 2.9% |
| Bermudans | 83.8 /100 | #139 | Excellent 2.9% |
| Immigrants | Jordan | 83.7 /100 | #140 | Excellent 2.9% |
| Sub-Saharan Africans | 83.3 /100 | #141 | Excellent 2.9% |
| Laotians | 81.1 /100 | #142 | Excellent 2.9% |
| Immigrants | Bahamas | 80.9 /100 | #143 | Excellent 2.9% |
| Immigrants | Bulgaria | 79.2 /100 | #144 | Good 2.9% |
| Immigrants | Congo | 78.9 /100 | #145 | Good 2.9% |
| Brazilians | 78.7 /100 | #146 | Good 2.9% |
| Tongans | 78.6 /100 | #147 | Good 2.9% |
| Immigrants | Russia | 77.7 /100 | #148 | Good 2.9% |
| Immigrants | Panama | 76.9 /100 | #149 | Good 2.9% |
| Palestinians | 73.6 /100 | #150 | Good 2.9% |
| Immigrants | France | 73.1 /100 | #151 | Good 2.9% |