Nonimmigrants vs Immigrants from Bulgaria Hearing Disability
COMPARE
Nonimmigrants
Immigrants from Bulgaria
Hearing Disability
Hearing Disability Comparison
Nonimmigrants
Immigrants from Bulgaria
3.6%
HEARING DISABILITY
0.0/ 100
METRIC RATING
277th/ 347
METRIC RANK
2.9%
HEARING DISABILITY
79.2/ 100
METRIC RATING
144th/ 347
METRIC RANK
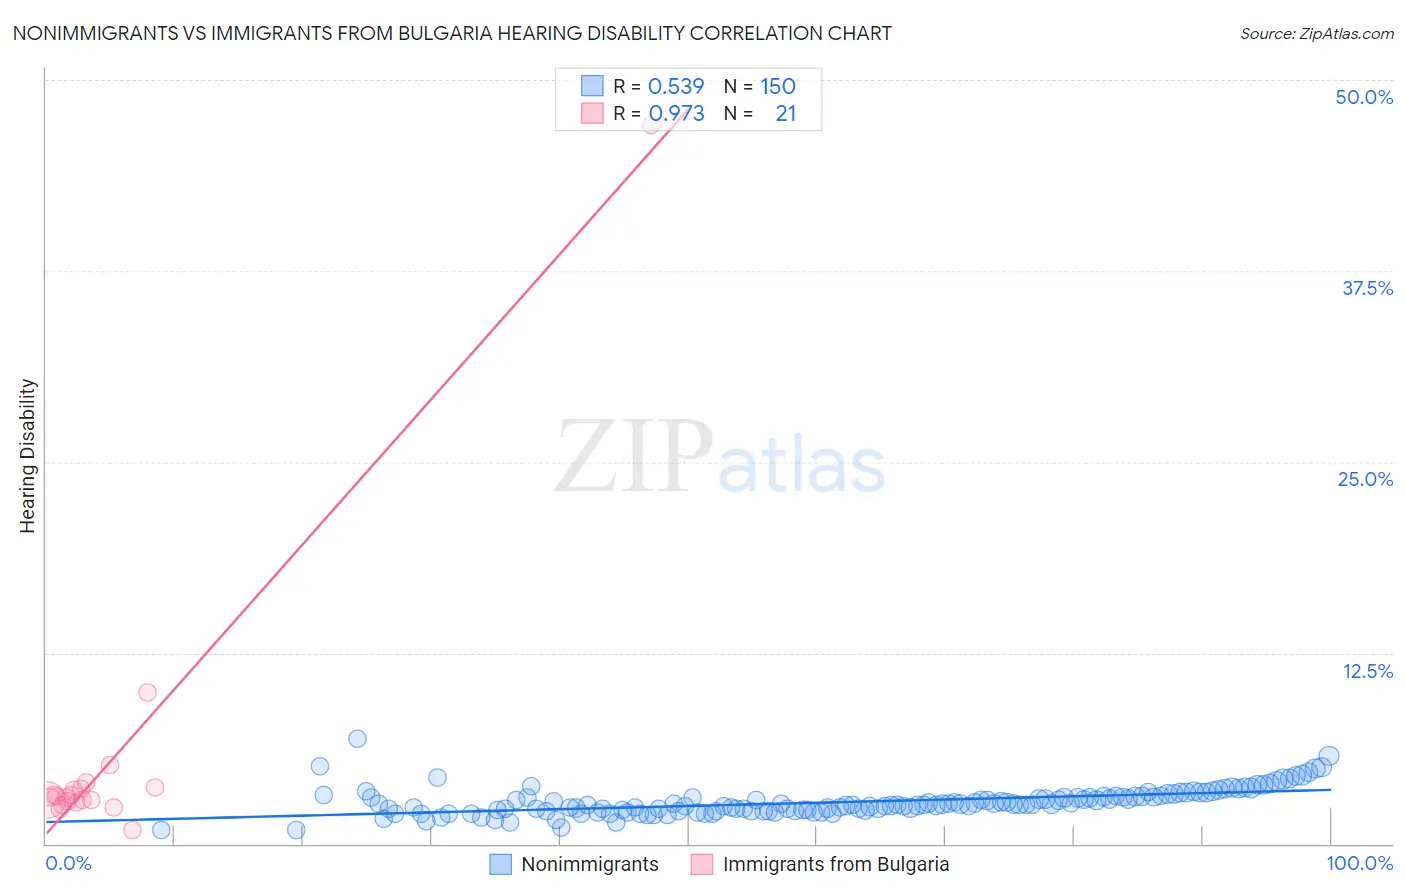
Nonimmigrants vs Immigrants from Bulgaria Hearing Disability Correlation Chart
The statistical analysis conducted on geographies consisting of 583,885,168 people shows a substantial positive correlation between the proportion of Nonimmigrants and percentage of population with hearing disability in the United States with a correlation coefficient (R) of 0.539 and weighted average of 3.6%. Similarly, the statistical analysis conducted on geographies consisting of 172,536,031 people shows a perfect positive correlation between the proportion of Immigrants from Bulgaria and percentage of population with hearing disability in the United States with a correlation coefficient (R) of 0.973 and weighted average of 2.9%, a difference of 23.4%.
Hearing Disability Correlation Summary
| Measurement | Nonimmigrants | Immigrants from Bulgaria |
| Minimum | 0.87% | 0.89% |
| Maximum | 6.9% | 47.1% |
| Range | 6.0% | 46.2% |
| Mean | 2.7% | 5.5% |
| Median | 2.6% | 3.1% |
| Interquartile 25% (IQ1) | 2.2% | 2.8% |
| Interquartile 75% (IQ3) | 3.1% | 3.6% |
| Interquartile Range (IQR) | 0.92% | 0.89% |
| Standard Deviation (Sample) | 0.88% | 9.7% |
| Standard Deviation (Population) | 0.88% | 9.4% |
Similar Demographics by Hearing Disability
Demographics Similar to Nonimmigrants by Hearing Disability
In terms of hearing disability, the demographic groups most similar to Nonimmigrants are Basque (3.6%, a difference of 0.39%), Slovak (3.6%, a difference of 0.65%), Danish (3.6%, a difference of 0.70%), French American Indian (3.6%, a difference of 0.72%), and Scandinavian (3.6%, a difference of 0.78%).
| Demographics | Rating | Rank | Hearing Disability |
| Europeans | 0.1 /100 | #270 | Tragic 3.5% |
| Czechs | 0.1 /100 | #271 | Tragic 3.5% |
| Fijians | 0.0 /100 | #272 | Tragic 3.5% |
| Puerto Ricans | 0.0 /100 | #273 | Tragic 3.5% |
| Swiss | 0.0 /100 | #274 | Tragic 3.5% |
| Czechoslovakians | 0.0 /100 | #275 | Tragic 3.6% |
| Danes | 0.0 /100 | #276 | Tragic 3.6% |
| Immigrants | Nonimmigrants | 0.0 /100 | #277 | Tragic 3.6% |
| Basques | 0.0 /100 | #278 | Tragic 3.6% |
| Slovaks | 0.0 /100 | #279 | Tragic 3.6% |
| French American Indians | 0.0 /100 | #280 | Tragic 3.6% |
| Scandinavians | 0.0 /100 | #281 | Tragic 3.6% |
| Swedes | 0.0 /100 | #282 | Tragic 3.6% |
| Blackfeet | 0.0 /100 | #283 | Tragic 3.6% |
| Immigrants | Micronesia | 0.0 /100 | #284 | Tragic 3.6% |
Demographics Similar to Immigrants from Bulgaria by Hearing Disability
In terms of hearing disability, the demographic groups most similar to Immigrants from Bulgaria are Immigrants from Congo (2.9%, a difference of 0.050%), Brazilian (2.9%, a difference of 0.070%), Tongan (2.9%, a difference of 0.080%), Immigrants from Russia (2.9%, a difference of 0.21%), and Immigrants from Bahamas (2.9%, a difference of 0.27%).
| Demographics | Rating | Rank | Hearing Disability |
| Sri Lankans | 84.1 /100 | #137 | Excellent 2.9% |
| Immigrants | Costa Rica | 84.0 /100 | #138 | Excellent 2.9% |
| Bermudans | 83.8 /100 | #139 | Excellent 2.9% |
| Immigrants | Jordan | 83.7 /100 | #140 | Excellent 2.9% |
| Sub-Saharan Africans | 83.3 /100 | #141 | Excellent 2.9% |
| Laotians | 81.1 /100 | #142 | Excellent 2.9% |
| Immigrants | Bahamas | 80.9 /100 | #143 | Excellent 2.9% |
| Immigrants | Bulgaria | 79.2 /100 | #144 | Good 2.9% |
| Immigrants | Congo | 78.9 /100 | #145 | Good 2.9% |
| Brazilians | 78.7 /100 | #146 | Good 2.9% |
| Tongans | 78.6 /100 | #147 | Good 2.9% |
| Immigrants | Russia | 77.7 /100 | #148 | Good 2.9% |
| Immigrants | Panama | 76.9 /100 | #149 | Good 2.9% |
| Palestinians | 73.6 /100 | #150 | Good 2.9% |
| Immigrants | France | 73.1 /100 | #151 | Good 2.9% |