Immigrants from Central America vs Pakistani Disability Age 65 to 74
COMPARE
Immigrants from Central America
Pakistani
Disability Age 65 to 74
Disability Age 65 to 74 Comparison
Immigrants from Central America
Pakistanis
26.6%
DISABILITY AGE 65 TO 74
0.0/ 100
METRIC RATING
293rd/ 347
METRIC RANK
23.2%
DISABILITY AGE 65 TO 74
57.0/ 100
METRIC RATING
168th/ 347
METRIC RANK
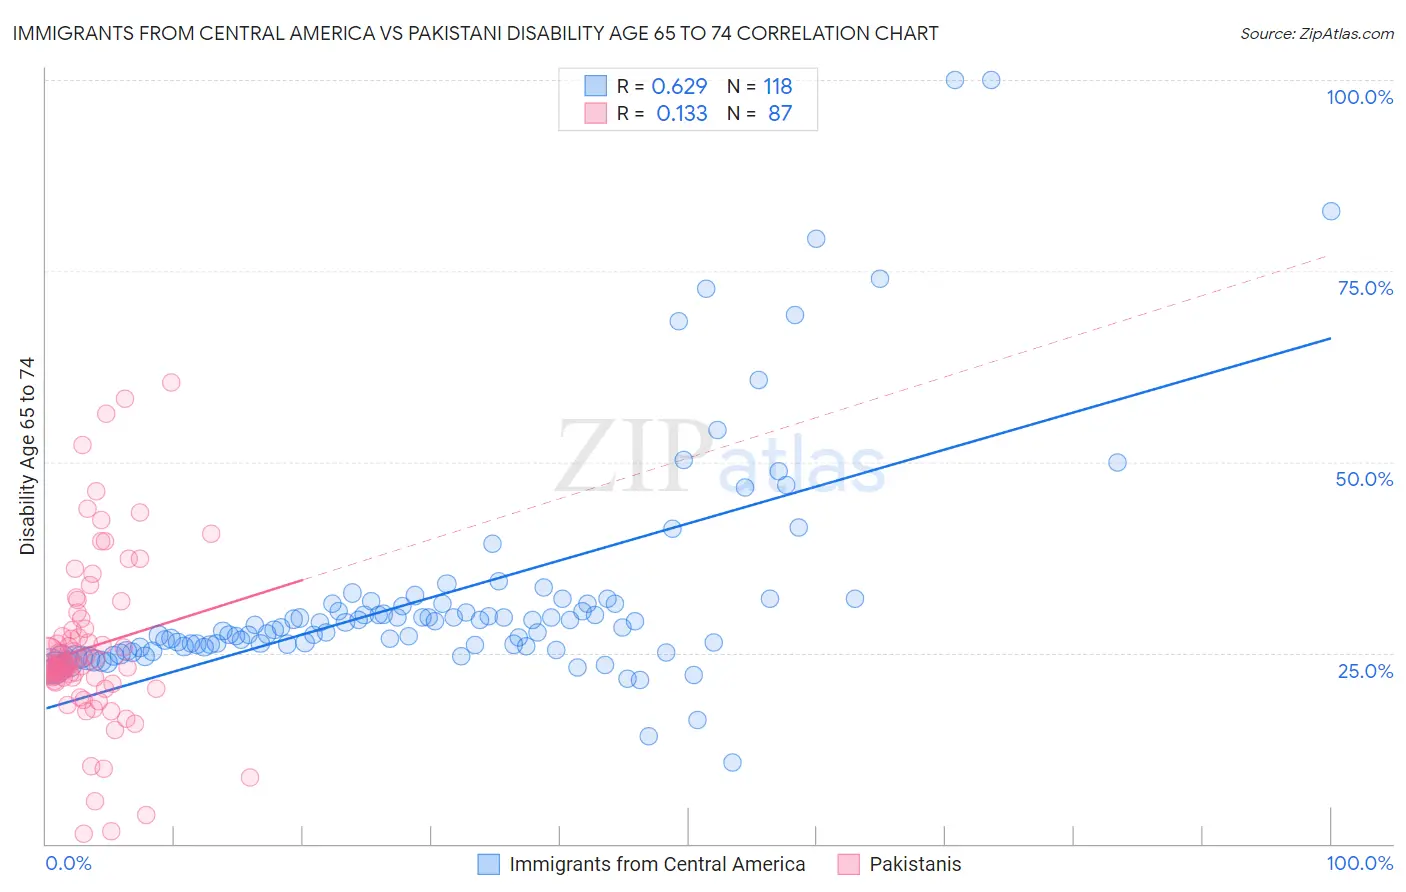
Immigrants from Central America vs Pakistani Disability Age 65 to 74 Correlation Chart
The statistical analysis conducted on geographies consisting of 534,691,138 people shows a significant positive correlation between the proportion of Immigrants from Central America and percentage of population with a disability between the ages 65 and 75 in the United States with a correlation coefficient (R) of 0.629 and weighted average of 26.6%. Similarly, the statistical analysis conducted on geographies consisting of 334,780,932 people shows a poor positive correlation between the proportion of Pakistanis and percentage of population with a disability between the ages 65 and 75 in the United States with a correlation coefficient (R) of 0.133 and weighted average of 23.2%, a difference of 14.6%.
Disability Age 65 to 74 Correlation Summary
| Measurement | Immigrants from Central America | Pakistani |
| Minimum | 10.7% | 1.3% |
| Maximum | 100.0% | 60.4% |
| Range | 89.3% | 59.1% |
| Mean | 32.6% | 25.7% |
| Median | 28.4% | 23.4% |
| Interquartile 25% (IQ1) | 25.8% | 21.4% |
| Interquartile 75% (IQ3) | 31.4% | 28.1% |
| Interquartile Range (IQR) | 5.6% | 6.7% |
| Standard Deviation (Sample) | 15.1% | 11.0% |
| Standard Deviation (Population) | 15.1% | 11.0% |
Similar Demographics by Disability Age 65 to 74
Demographics Similar to Immigrants from Central America by Disability Age 65 to 74
In terms of disability age 65 to 74, the demographic groups most similar to Immigrants from Central America are Dominican (26.7%, a difference of 0.11%), Hispanic or Latino (26.7%, a difference of 0.13%), Blackfeet (26.6%, a difference of 0.16%), Bangladeshi (26.8%, a difference of 0.74%), and Spanish American Indian (26.4%, a difference of 1.0%).
| Demographics | Rating | Rank | Disability Age 65 to 74 |
| Immigrants | Micronesia | 0.0 /100 | #286 | Tragic 26.1% |
| Immigrants | Laos | 0.0 /100 | #287 | Tragic 26.1% |
| Mexican American Indians | 0.0 /100 | #288 | Tragic 26.2% |
| Africans | 0.0 /100 | #289 | Tragic 26.2% |
| Immigrants | Cabo Verde | 0.0 /100 | #290 | Tragic 26.3% |
| Spanish American Indians | 0.0 /100 | #291 | Tragic 26.4% |
| Blackfeet | 0.0 /100 | #292 | Tragic 26.6% |
| Immigrants | Central America | 0.0 /100 | #293 | Tragic 26.6% |
| Dominicans | 0.0 /100 | #294 | Tragic 26.7% |
| Hispanics or Latinos | 0.0 /100 | #295 | Tragic 26.7% |
| Bangladeshis | 0.0 /100 | #296 | Tragic 26.8% |
| Fijians | 0.0 /100 | #297 | Tragic 27.0% |
| Immigrants | Yemen | 0.0 /100 | #298 | Tragic 27.0% |
| Potawatomi | 0.0 /100 | #299 | Tragic 27.0% |
| Immigrants | Dominican Republic | 0.0 /100 | #300 | Tragic 27.0% |
Demographics Similar to Pakistanis by Disability Age 65 to 74
In terms of disability age 65 to 74, the demographic groups most similar to Pakistanis are Immigrants from Bosnia and Herzegovina (23.2%, a difference of 0.040%), Icelander (23.3%, a difference of 0.16%), Moroccan (23.3%, a difference of 0.16%), Immigrants from Afghanistan (23.2%, a difference of 0.22%), and Vietnamese (23.2%, a difference of 0.23%).
| Demographics | Rating | Rank | Disability Age 65 to 74 |
| Immigrants | Cameroon | 63.8 /100 | #161 | Good 23.1% |
| Europeans | 61.2 /100 | #162 | Good 23.2% |
| Immigrants | Philippines | 61.1 /100 | #163 | Good 23.2% |
| Sierra Leoneans | 60.9 /100 | #164 | Good 23.2% |
| Vietnamese | 60.8 /100 | #165 | Good 23.2% |
| Immigrants | Afghanistan | 60.5 /100 | #166 | Good 23.2% |
| Immigrants | Bosnia and Herzegovina | 57.6 /100 | #167 | Average 23.2% |
| Pakistanis | 57.0 /100 | #168 | Average 23.2% |
| Icelanders | 54.3 /100 | #169 | Average 23.3% |
| Moroccans | 54.2 /100 | #170 | Average 23.3% |
| Cubans | 51.9 /100 | #171 | Average 23.3% |
| Germans | 50.5 /100 | #172 | Average 23.3% |
| Yugoslavians | 50.2 /100 | #173 | Average 23.3% |
| Immigrants | South Eastern Asia | 50.0 /100 | #174 | Average 23.3% |
| Dutch | 49.4 /100 | #175 | Average 23.3% |