Immigrants from Central America vs Alaskan Athabascan Single Father Households
COMPARE
Immigrants from Central America
Alaskan Athabascan
Single Father Households
Single Father Households Comparison
Immigrants from Central America
Alaskan Athabascans
3.0%
SINGLE FATHER HOUSEHOLDS
0.0/ 100
METRIC RATING
323rd/ 347
METRIC RANK
3.4%
SINGLE FATHER HOUSEHOLDS
0.0/ 100
METRIC RATING
339th/ 347
METRIC RANK
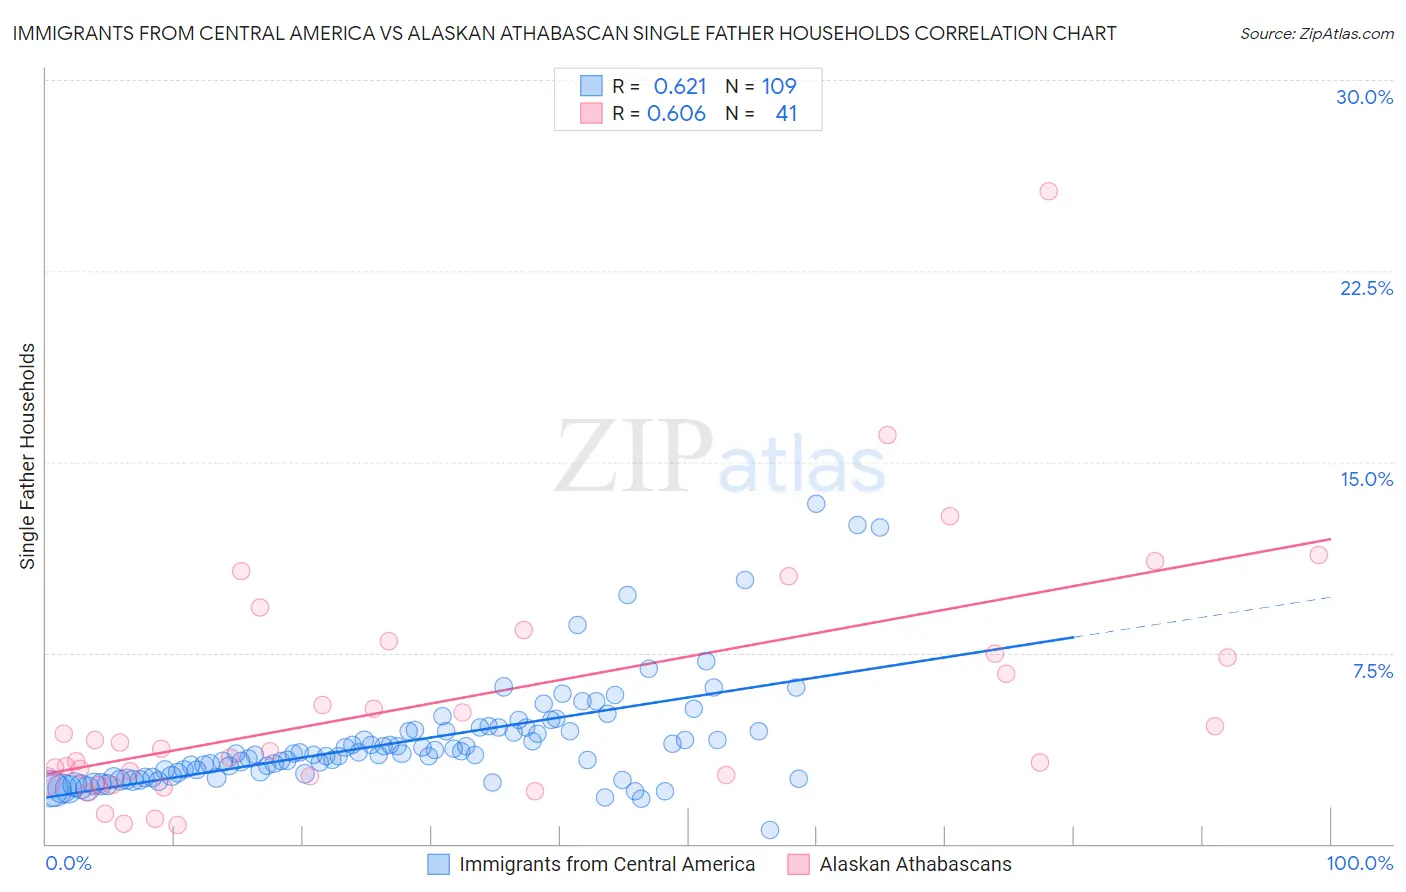
Immigrants from Central America vs Alaskan Athabascan Single Father Households Correlation Chart
The statistical analysis conducted on geographies consisting of 526,445,722 people shows a significant positive correlation between the proportion of Immigrants from Central America and percentage of single father households in the United States with a correlation coefficient (R) of 0.621 and weighted average of 3.0%. Similarly, the statistical analysis conducted on geographies consisting of 45,717,471 people shows a significant positive correlation between the proportion of Alaskan Athabascans and percentage of single father households in the United States with a correlation coefficient (R) of 0.606 and weighted average of 3.4%, a difference of 12.5%.
Single Father Households Correlation Summary
| Measurement | Immigrants from Central America | Alaskan Athabascan |
| Minimum | 0.56% | 0.71% |
| Maximum | 13.4% | 25.6% |
| Range | 12.8% | 24.9% |
| Mean | 4.0% | 5.6% |
| Median | 3.5% | 3.7% |
| Interquartile 25% (IQ1) | 2.6% | 2.6% |
| Interquartile 75% (IQ3) | 4.5% | 7.7% |
| Interquartile Range (IQR) | 1.8% | 5.2% |
| Standard Deviation (Sample) | 2.1% | 4.9% |
| Standard Deviation (Population) | 2.1% | 4.8% |
Demographics Similar to Immigrants from Central America and Alaskan Athabascans by Single Father Households
In terms of single father households, the demographic groups most similar to Immigrants from Central America are Fijian (3.0%, a difference of 0.080%), Immigrants from Guatemala (3.0%, a difference of 0.31%), Mexican (3.0%, a difference of 0.84%), Immigrants from Mexico (3.0%, a difference of 1.3%), and Aleut (3.0%, a difference of 1.5%). Similarly, the demographic groups most similar to Alaskan Athabascans are Sioux (3.3%, a difference of 1.5%), Pueblo (3.3%, a difference of 2.1%), Paiute (3.3%, a difference of 2.4%), Colville (3.3%, a difference of 2.4%), and Yuman (3.3%, a difference of 2.5%).
| Demographics | Rating | Rank | Single Father Households |
| Mexicans | 0.0 /100 | #321 | Tragic 3.0% |
| Immigrants | Guatemala | 0.0 /100 | #322 | Tragic 3.0% |
| Immigrants | Central America | 0.0 /100 | #323 | Tragic 3.0% |
| Fijians | 0.0 /100 | #324 | Tragic 3.0% |
| Immigrants | Mexico | 0.0 /100 | #325 | Tragic 3.0% |
| Aleuts | 0.0 /100 | #326 | Tragic 3.0% |
| Bangladeshis | 0.0 /100 | #327 | Tragic 3.1% |
| Immigrants | Cabo Verde | 0.0 /100 | #328 | Tragic 3.1% |
| Chippewa | 0.0 /100 | #329 | Tragic 3.1% |
| Nepalese | 0.0 /100 | #330 | Tragic 3.1% |
| Navajo | 0.0 /100 | #331 | Tragic 3.2% |
| Yaqui | 0.0 /100 | #332 | Tragic 3.2% |
| Natives/Alaskans | 0.0 /100 | #333 | Tragic 3.2% |
| Yuman | 0.0 /100 | #334 | Tragic 3.3% |
| Colville | 0.0 /100 | #335 | Tragic 3.3% |
| Paiute | 0.0 /100 | #336 | Tragic 3.3% |
| Pueblo | 0.0 /100 | #337 | Tragic 3.3% |
| Sioux | 0.0 /100 | #338 | Tragic 3.3% |
| Alaskan Athabascans | 0.0 /100 | #339 | Tragic 3.4% |
| Alaska Natives | 0.0 /100 | #340 | Tragic 3.5% |
| Crow | 0.0 /100 | #341 | Tragic 3.5% |