Immigrants from Caribbean vs Cherokee Male Disability
COMPARE
Immigrants from Caribbean
Cherokee
Male Disability
Male Disability Comparison
Immigrants from Caribbean
Cherokee
11.3%
MALE DISABILITY
41.4/ 100
METRIC RATING
179th/ 347
METRIC RANK
14.8%
MALE DISABILITY
0.0/ 100
METRIC RATING
334th/ 347
METRIC RANK
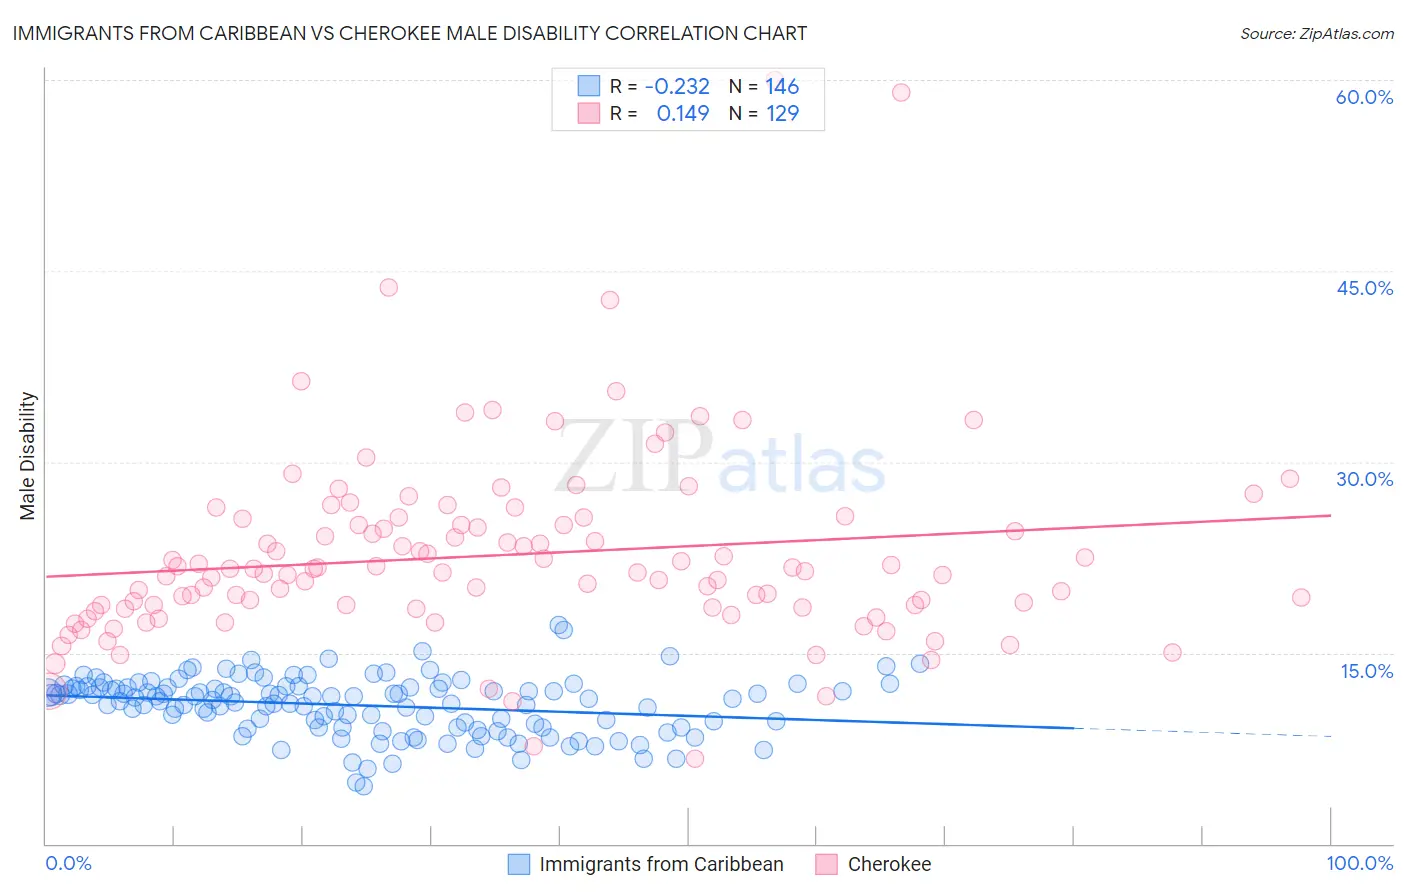
Immigrants from Caribbean vs Cherokee Male Disability Correlation Chart
The statistical analysis conducted on geographies consisting of 449,911,553 people shows a weak negative correlation between the proportion of Immigrants from Caribbean and percentage of males with a disability in the United States with a correlation coefficient (R) of -0.232 and weighted average of 11.3%. Similarly, the statistical analysis conducted on geographies consisting of 493,554,719 people shows a poor positive correlation between the proportion of Cherokee and percentage of males with a disability in the United States with a correlation coefficient (R) of 0.149 and weighted average of 14.8%, a difference of 31.6%.
Male Disability Correlation Summary
| Measurement | Immigrants from Caribbean | Cherokee |
| Minimum | 4.5% | 6.7% |
| Maximum | 17.2% | 60.0% |
| Range | 12.7% | 53.3% |
| Mean | 10.9% | 22.7% |
| Median | 11.4% | 21.4% |
| Interquartile 25% (IQ1) | 9.2% | 18.5% |
| Interquartile 75% (IQ3) | 12.3% | 25.3% |
| Interquartile Range (IQR) | 3.2% | 6.7% |
| Standard Deviation (Sample) | 2.3% | 7.6% |
| Standard Deviation (Population) | 2.2% | 7.6% |
Similar Demographics by Male Disability
Demographics Similar to Immigrants from Caribbean by Male Disability
In terms of male disability, the demographic groups most similar to Immigrants from Caribbean are Honduran (11.3%, a difference of 0.020%), Australian (11.3%, a difference of 0.040%), Immigrants from Norway (11.3%, a difference of 0.15%), Syrian (11.2%, a difference of 0.29%), and Immigrants from Honduras (11.2%, a difference of 0.41%).
| Demographics | Rating | Rank | Male Disability |
| Romanians | 50.7 /100 | #172 | Average 11.2% |
| Immigrants | Burma/Myanmar | 50.4 /100 | #173 | Average 11.2% |
| Maltese | 50.0 /100 | #174 | Average 11.2% |
| Immigrants | Honduras | 48.7 /100 | #175 | Average 11.2% |
| Syrians | 46.6 /100 | #176 | Average 11.2% |
| Immigrants | Norway | 44.2 /100 | #177 | Average 11.3% |
| Australians | 42.2 /100 | #178 | Average 11.3% |
| Immigrants | Caribbean | 41.4 /100 | #179 | Average 11.3% |
| Hondurans | 41.1 /100 | #180 | Average 11.3% |
| Immigrants | Senegal | 34.4 /100 | #181 | Fair 11.3% |
| Immigrants | Belize | 33.7 /100 | #182 | Fair 11.3% |
| Immigrants | Central America | 32.9 /100 | #183 | Fair 11.3% |
| Iraqis | 30.5 /100 | #184 | Fair 11.3% |
| Pakistanis | 30.3 /100 | #185 | Fair 11.3% |
| Immigrants | Zaire | 27.6 /100 | #186 | Fair 11.4% |
Demographics Similar to Cherokee by Male Disability
In terms of male disability, the demographic groups most similar to Cherokee are Dutch West Indian (14.8%, a difference of 0.020%), Alaskan Athabascan (14.9%, a difference of 0.49%), Yuman (14.7%, a difference of 0.68%), Seminole (14.7%, a difference of 0.78%), and Menominee (15.0%, a difference of 1.0%).
| Demographics | Rating | Rank | Male Disability |
| Potawatomi | 0.0 /100 | #327 | Tragic 14.2% |
| Chippewa | 0.0 /100 | #328 | Tragic 14.3% |
| Cajuns | 0.0 /100 | #329 | Tragic 14.4% |
| Navajo | 0.0 /100 | #330 | Tragic 14.4% |
| Tohono O'odham | 0.0 /100 | #331 | Tragic 14.6% |
| Seminole | 0.0 /100 | #332 | Tragic 14.7% |
| Yuman | 0.0 /100 | #333 | Tragic 14.7% |
| Cherokee | 0.0 /100 | #334 | Tragic 14.8% |
| Dutch West Indians | 0.0 /100 | #335 | Tragic 14.8% |
| Alaskan Athabascans | 0.0 /100 | #336 | Tragic 14.9% |
| Menominee | 0.0 /100 | #337 | Tragic 15.0% |
| Pueblo | 0.0 /100 | #338 | Tragic 15.0% |
| Chickasaw | 0.0 /100 | #339 | Tragic 15.1% |
| Lumbee | 0.0 /100 | #340 | Tragic 15.2% |
| Choctaw | 0.0 /100 | #341 | Tragic 15.4% |