Immigrants from Caribbean vs Nigerian Unemployment Among Ages 16 to 19 years
COMPARE
Immigrants from Caribbean
Nigerian
Unemployment Among Ages 16 to 19 years
Unemployment Among Ages 16 to 19 years Comparison
Immigrants from Caribbean
Nigerians
20.9%
UNEMPLOYMENT AMONG AGES 16 TO 19 YEARS
0.0/ 100
METRIC RATING
302nd/ 347
METRIC RANK
18.9%
UNEMPLOYMENT AMONG AGES 16 TO 19 YEARS
0.2/ 100
METRIC RATING
260th/ 347
METRIC RANK
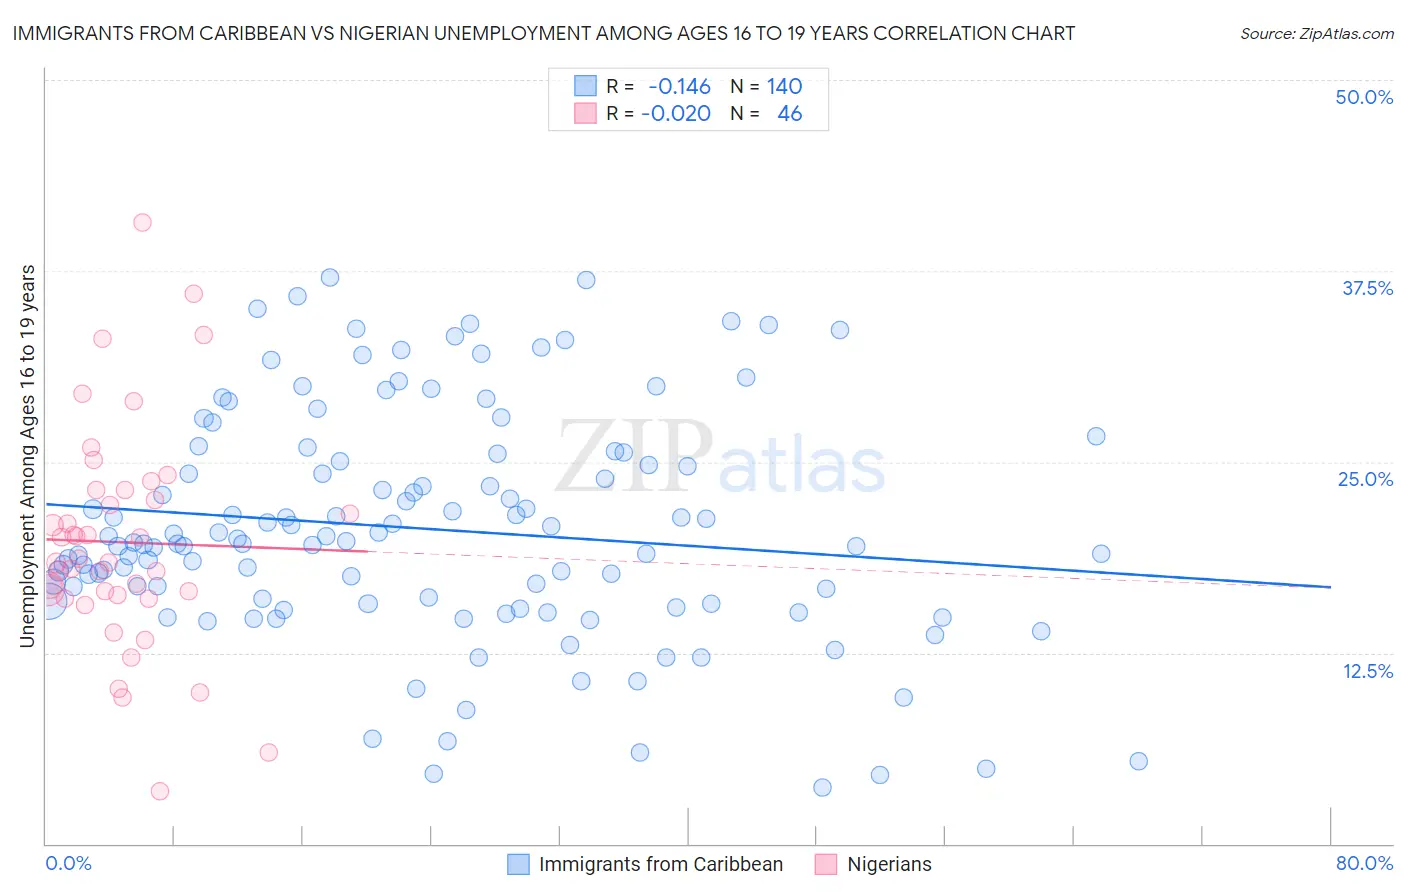
Immigrants from Caribbean vs Nigerian Unemployment Among Ages 16 to 19 years Correlation Chart
The statistical analysis conducted on geographies consisting of 422,539,513 people shows a poor negative correlation between the proportion of Immigrants from Caribbean and unemployment rate among population between the ages 16 and 19 in the United States with a correlation coefficient (R) of -0.146 and weighted average of 20.9%. Similarly, the statistical analysis conducted on geographies consisting of 322,180,468 people shows no correlation between the proportion of Nigerians and unemployment rate among population between the ages 16 and 19 in the United States with a correlation coefficient (R) of -0.020 and weighted average of 18.9%, a difference of 10.4%.
Unemployment Among Ages 16 to 19 years Correlation Summary
| Measurement | Immigrants from Caribbean | Nigerian |
| Minimum | 3.7% | 3.4% |
| Maximum | 37.1% | 40.6% |
| Range | 33.4% | 37.2% |
| Mean | 20.6% | 19.7% |
| Median | 19.7% | 18.5% |
| Interquartile 25% (IQ1) | 15.8% | 16.3% |
| Interquartile 75% (IQ3) | 25.3% | 23.1% |
| Interquartile Range (IQR) | 9.5% | 6.8% |
| Standard Deviation (Sample) | 7.4% | 7.3% |
| Standard Deviation (Population) | 7.4% | 7.2% |
Similar Demographics by Unemployment Among Ages 16 to 19 years
Demographics Similar to Immigrants from Caribbean by Unemployment Among Ages 16 to 19 years
In terms of unemployment among ages 16 to 19 years, the demographic groups most similar to Immigrants from Caribbean are Immigrants from Ecuador (20.9%, a difference of 0.11%), Senegalese (21.0%, a difference of 0.38%), Aleut (21.2%, a difference of 1.2%), Immigrants from Senegal (21.2%, a difference of 1.4%), and Ecuadorian (20.5%, a difference of 1.7%).
| Demographics | Rating | Rank | Unemployment Among Ages 16 to 19 years |
| Central American Indians | 0.0 /100 | #295 | Tragic 20.4% |
| Armenians | 0.0 /100 | #296 | Tragic 20.5% |
| Alsatians | 0.0 /100 | #297 | Tragic 20.5% |
| Haitians | 0.0 /100 | #298 | Tragic 20.5% |
| Immigrants | Uzbekistan | 0.0 /100 | #299 | Tragic 20.5% |
| Ecuadorians | 0.0 /100 | #300 | Tragic 20.5% |
| Immigrants | Ecuador | 0.0 /100 | #301 | Tragic 20.9% |
| Immigrants | Caribbean | 0.0 /100 | #302 | Tragic 20.9% |
| Senegalese | 0.0 /100 | #303 | Tragic 21.0% |
| Aleuts | 0.0 /100 | #304 | Tragic 21.2% |
| Immigrants | Senegal | 0.0 /100 | #305 | Tragic 21.2% |
| U.S. Virgin Islanders | 0.0 /100 | #306 | Tragic 21.3% |
| Blacks/African Americans | 0.0 /100 | #307 | Tragic 21.4% |
| Immigrants | Bangladesh | 0.0 /100 | #308 | Tragic 21.5% |
| Natives/Alaskans | 0.0 /100 | #309 | Tragic 21.5% |
Demographics Similar to Nigerians by Unemployment Among Ages 16 to 19 years
In terms of unemployment among ages 16 to 19 years, the demographic groups most similar to Nigerians are Spanish American Indian (18.9%, a difference of 0.040%), Immigrants from Central America (18.9%, a difference of 0.080%), Salvadoran (18.9%, a difference of 0.080%), Immigrants from Mexico (18.9%, a difference of 0.16%), and Cree (19.0%, a difference of 0.22%).
| Demographics | Rating | Rank | Unemployment Among Ages 16 to 19 years |
| Central Americans | 0.3 /100 | #253 | Tragic 18.8% |
| Apache | 0.3 /100 | #254 | Tragic 18.8% |
| Immigrants | Cameroon | 0.3 /100 | #255 | Tragic 18.8% |
| Mexican American Indians | 0.3 /100 | #256 | Tragic 18.8% |
| Immigrants | Nigeria | 0.2 /100 | #257 | Tragic 18.9% |
| Immigrants | Mexico | 0.2 /100 | #258 | Tragic 18.9% |
| Immigrants | Central America | 0.2 /100 | #259 | Tragic 18.9% |
| Nigerians | 0.2 /100 | #260 | Tragic 18.9% |
| Spanish American Indians | 0.1 /100 | #261 | Tragic 18.9% |
| Salvadorans | 0.1 /100 | #262 | Tragic 18.9% |
| Cree | 0.1 /100 | #263 | Tragic 19.0% |
| Yaqui | 0.1 /100 | #264 | Tragic 19.0% |
| Choctaw | 0.1 /100 | #265 | Tragic 19.0% |
| Immigrants | Honduras | 0.1 /100 | #266 | Tragic 19.0% |
| Israelis | 0.1 /100 | #267 | Tragic 19.0% |