Immigrants from Caribbean vs Nigerian Child Poverty Under the Age of 5
COMPARE
Immigrants from Caribbean
Nigerian
Child Poverty Under the Age of 5
Child Poverty Under the Age of 5 Comparison
Immigrants from Caribbean
Nigerians
21.4%
CHILD POVERTY UNDER THE AGE OF 5
0.0/ 100
METRIC RATING
290th/ 347
METRIC RANK
19.1%
CHILD POVERTY UNDER THE AGE OF 5
1.6/ 100
METRIC RATING
225th/ 347
METRIC RANK
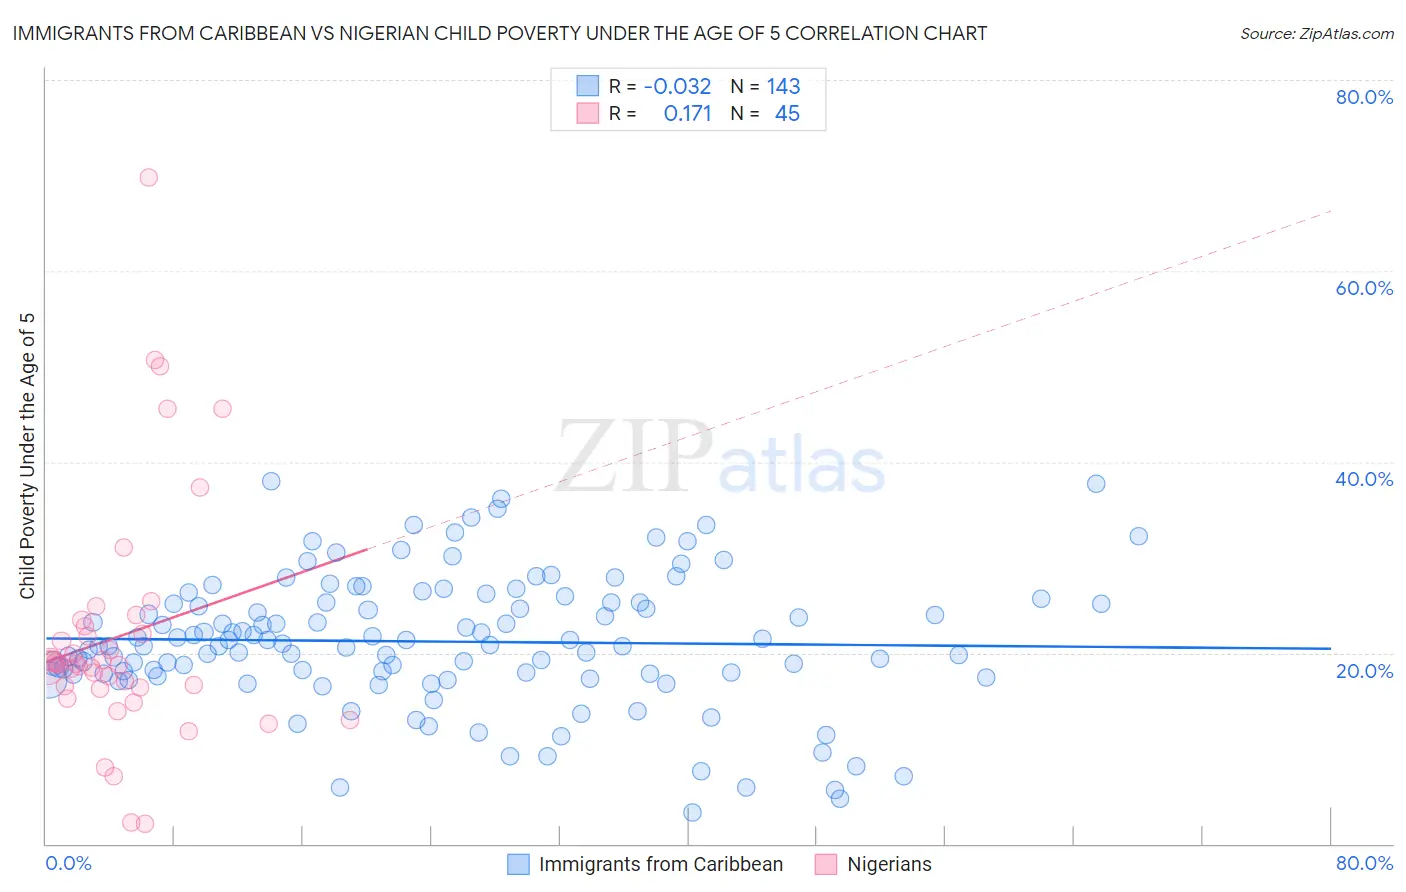
Immigrants from Caribbean vs Nigerian Child Poverty Under the Age of 5 Correlation Chart
The statistical analysis conducted on geographies consisting of 429,670,121 people shows no correlation between the proportion of Immigrants from Caribbean and poverty level among children under the age of 5 in the United States with a correlation coefficient (R) of -0.032 and weighted average of 21.4%. Similarly, the statistical analysis conducted on geographies consisting of 324,589,829 people shows a poor positive correlation between the proportion of Nigerians and poverty level among children under the age of 5 in the United States with a correlation coefficient (R) of 0.171 and weighted average of 19.1%, a difference of 12.1%.
Child Poverty Under the Age of 5 Correlation Summary
| Measurement | Immigrants from Caribbean | Nigerian |
| Minimum | 3.3% | 2.1% |
| Maximum | 38.0% | 69.8% |
| Range | 34.7% | 67.7% |
| Mean | 21.2% | 21.8% |
| Median | 20.8% | 18.8% |
| Interquartile 25% (IQ1) | 17.8% | 16.3% |
| Interquartile 75% (IQ3) | 25.3% | 23.1% |
| Interquartile Range (IQR) | 7.5% | 6.8% |
| Standard Deviation (Sample) | 6.9% | 12.9% |
| Standard Deviation (Population) | 6.8% | 12.7% |
Similar Demographics by Child Poverty Under the Age of 5
Demographics Similar to Immigrants from Caribbean by Child Poverty Under the Age of 5
In terms of child poverty under the age of 5, the demographic groups most similar to Immigrants from Caribbean are British West Indian (21.4%, a difference of 0.17%), Immigrants from Haiti (21.3%, a difference of 0.41%), Immigrants from Senegal (21.3%, a difference of 0.48%), Immigrants from Zaire (21.3%, a difference of 0.65%), and Immigrants from Latin America (21.2%, a difference of 0.75%).
| Demographics | Rating | Rank | Child Poverty Under the Age of 5 |
| Comanche | 0.0 /100 | #283 | Tragic 21.0% |
| Somalis | 0.0 /100 | #284 | Tragic 21.1% |
| Haitians | 0.0 /100 | #285 | Tragic 21.2% |
| Immigrants | Latin America | 0.0 /100 | #286 | Tragic 21.2% |
| Immigrants | Zaire | 0.0 /100 | #287 | Tragic 21.3% |
| Immigrants | Senegal | 0.0 /100 | #288 | Tragic 21.3% |
| Immigrants | Haiti | 0.0 /100 | #289 | Tragic 21.3% |
| Immigrants | Caribbean | 0.0 /100 | #290 | Tragic 21.4% |
| British West Indians | 0.0 /100 | #291 | Tragic 21.4% |
| Immigrants | Somalia | 0.0 /100 | #292 | Tragic 21.6% |
| Mexicans | 0.0 /100 | #293 | Tragic 21.6% |
| Guatemalans | 0.0 /100 | #294 | Tragic 21.6% |
| Cherokee | 0.0 /100 | #295 | Tragic 21.7% |
| Yaqui | 0.0 /100 | #296 | Tragic 21.7% |
| Hispanics or Latinos | 0.0 /100 | #297 | Tragic 21.7% |
Demographics Similar to Nigerians by Child Poverty Under the Age of 5
In terms of child poverty under the age of 5, the demographic groups most similar to Nigerians are Immigrants from Eritrea (19.1%, a difference of 0.020%), Nicaraguan (19.1%, a difference of 0.030%), Cuban (19.1%, a difference of 0.14%), Alsatian (19.1%, a difference of 0.16%), and Cape Verdean (19.1%, a difference of 0.20%).
| Demographics | Rating | Rank | Child Poverty Under the Age of 5 |
| Delaware | 3.4 /100 | #218 | Tragic 18.7% |
| German Russians | 3.0 /100 | #219 | Tragic 18.8% |
| Immigrants | Azores | 2.6 /100 | #220 | Tragic 18.9% |
| Immigrants | Nigeria | 2.1 /100 | #221 | Tragic 19.0% |
| Alsatians | 1.7 /100 | #222 | Tragic 19.1% |
| Cubans | 1.7 /100 | #223 | Tragic 19.1% |
| Nicaraguans | 1.6 /100 | #224 | Tragic 19.1% |
| Nigerians | 1.6 /100 | #225 | Tragic 19.1% |
| Immigrants | Eritrea | 1.5 /100 | #226 | Tragic 19.1% |
| Cape Verdeans | 1.4 /100 | #227 | Tragic 19.1% |
| Immigrants | Sudan | 1.3 /100 | #228 | Tragic 19.2% |
| Ghanaians | 1.2 /100 | #229 | Tragic 19.2% |
| Ecuadorians | 1.2 /100 | #230 | Tragic 19.2% |
| Bermudans | 1.2 /100 | #231 | Tragic 19.2% |
| Trinidadians and Tobagonians | 0.9 /100 | #232 | Tragic 19.3% |