Immigrants from Caribbean vs Bahamian Self-Care Disability
COMPARE
Immigrants from Caribbean
Bahamian
Self-Care Disability
Self-Care Disability Comparison
Immigrants from Caribbean
Bahamians
2.8%
SELF-CARE DISABILITY
0.0/ 100
METRIC RATING
312th/ 347
METRIC RANK
2.6%
SELF-CARE DISABILITY
2.0/ 100
METRIC RATING
235th/ 347
METRIC RANK
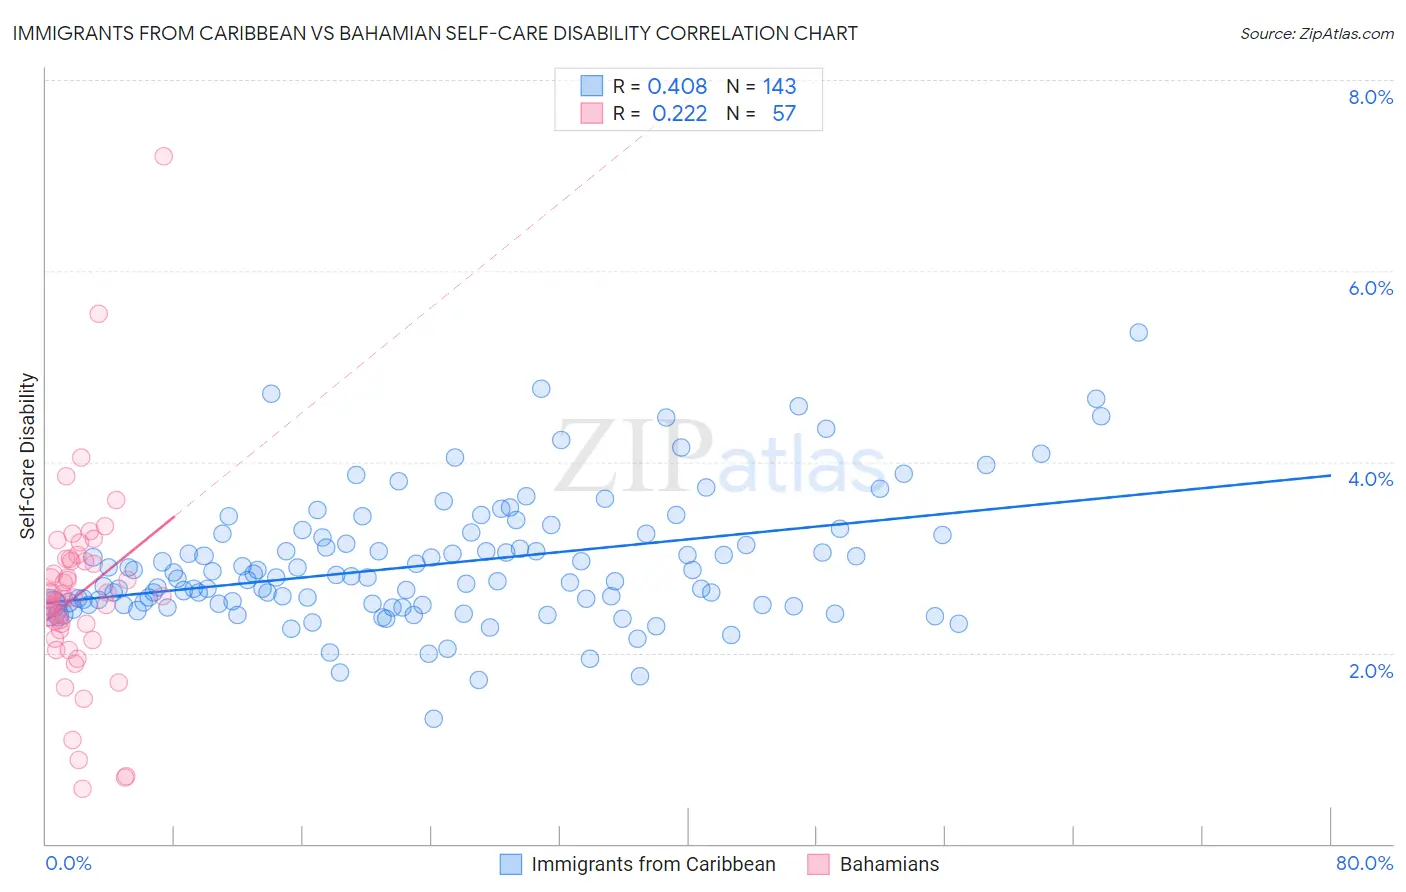
Immigrants from Caribbean vs Bahamian Self-Care Disability Correlation Chart
The statistical analysis conducted on geographies consisting of 449,223,668 people shows a moderate positive correlation between the proportion of Immigrants from Caribbean and percentage of population with self-care disability in the United States with a correlation coefficient (R) of 0.408 and weighted average of 2.8%. Similarly, the statistical analysis conducted on geographies consisting of 112,612,333 people shows a weak positive correlation between the proportion of Bahamians and percentage of population with self-care disability in the United States with a correlation coefficient (R) of 0.222 and weighted average of 2.6%, a difference of 9.6%.
Self-Care Disability Correlation Summary
| Measurement | Immigrants from Caribbean | Bahamian |
| Minimum | 1.3% | 0.58% |
| Maximum | 5.4% | 7.2% |
| Range | 4.1% | 6.6% |
| Mean | 2.9% | 2.6% |
| Median | 2.8% | 2.6% |
| Interquartile 25% (IQ1) | 2.5% | 2.2% |
| Interquartile 75% (IQ3) | 3.2% | 3.0% |
| Interquartile Range (IQR) | 0.74% | 0.77% |
| Standard Deviation (Sample) | 0.67% | 1.0% |
| Standard Deviation (Population) | 0.66% | 1.0% |
Similar Demographics by Self-Care Disability
Demographics Similar to Immigrants from Caribbean by Self-Care Disability
In terms of self-care disability, the demographic groups most similar to Immigrants from Caribbean are Spanish American (2.8%, a difference of 0.030%), Puget Sound Salish (2.8%, a difference of 0.19%), Creek (2.8%, a difference of 0.25%), British West Indian (2.8%, a difference of 0.26%), and Bangladeshi (2.8%, a difference of 0.36%).
| Demographics | Rating | Rank | Self-Care Disability |
| Immigrants | West Indies | 0.0 /100 | #305 | Tragic 2.8% |
| Aleuts | 0.0 /100 | #306 | Tragic 2.8% |
| Natives/Alaskans | 0.0 /100 | #307 | Tragic 2.8% |
| Immigrants | Grenada | 0.0 /100 | #308 | Tragic 2.8% |
| Bangladeshis | 0.0 /100 | #309 | Tragic 2.8% |
| British West Indians | 0.0 /100 | #310 | Tragic 2.8% |
| Puget Sound Salish | 0.0 /100 | #311 | Tragic 2.8% |
| Immigrants | Caribbean | 0.0 /100 | #312 | Tragic 2.8% |
| Spanish Americans | 0.0 /100 | #313 | Tragic 2.8% |
| Creek | 0.0 /100 | #314 | Tragic 2.8% |
| Immigrants | Cuba | 0.0 /100 | #315 | Tragic 2.8% |
| Menominee | 0.0 /100 | #316 | Tragic 2.8% |
| Immigrants | Dominica | 0.0 /100 | #317 | Tragic 2.8% |
| Assyrians/Chaldeans/Syriacs | 0.0 /100 | #318 | Tragic 2.8% |
| Spanish American Indians | 0.0 /100 | #319 | Tragic 2.9% |
Demographics Similar to Bahamians by Self-Care Disability
In terms of self-care disability, the demographic groups most similar to Bahamians are Liberian (2.6%, a difference of 0.040%), Vietnamese (2.6%, a difference of 0.040%), Bermudan (2.6%, a difference of 0.070%), Albanian (2.6%, a difference of 0.090%), and Immigrants from Guatemala (2.6%, a difference of 0.11%).
| Demographics | Rating | Rank | Self-Care Disability |
| Guatemalans | 2.7 /100 | #228 | Tragic 2.6% |
| Guamanians/Chamorros | 2.5 /100 | #229 | Tragic 2.6% |
| Immigrants | Ecuador | 2.5 /100 | #230 | Tragic 2.6% |
| Immigrants | Guatemala | 2.2 /100 | #231 | Tragic 2.6% |
| Albanians | 2.2 /100 | #232 | Tragic 2.6% |
| Liberians | 2.1 /100 | #233 | Tragic 2.6% |
| Vietnamese | 2.1 /100 | #234 | Tragic 2.6% |
| Bahamians | 2.0 /100 | #235 | Tragic 2.6% |
| Bermudans | 1.9 /100 | #236 | Tragic 2.6% |
| Immigrants | Senegal | 1.6 /100 | #237 | Tragic 2.6% |
| Senegalese | 1.3 /100 | #238 | Tragic 2.6% |
| Immigrants | Panama | 1.2 /100 | #239 | Tragic 2.6% |
| Marshallese | 1.2 /100 | #240 | Tragic 2.6% |
| Immigrants | Syria | 1.0 /100 | #241 | Tragic 2.6% |
| Spanish | 0.8 /100 | #242 | Tragic 2.6% |