Immigrants from Caribbean vs Immigrants from Moldova Self-Care Disability
COMPARE
Immigrants from Caribbean
Immigrants from Moldova
Self-Care Disability
Self-Care Disability Comparison
Immigrants from Caribbean
Immigrants from Moldova
2.8%
SELF-CARE DISABILITY
0.0/ 100
METRIC RATING
312th/ 347
METRIC RANK
2.6%
SELF-CARE DISABILITY
4.0/ 100
METRIC RATING
219th/ 347
METRIC RANK
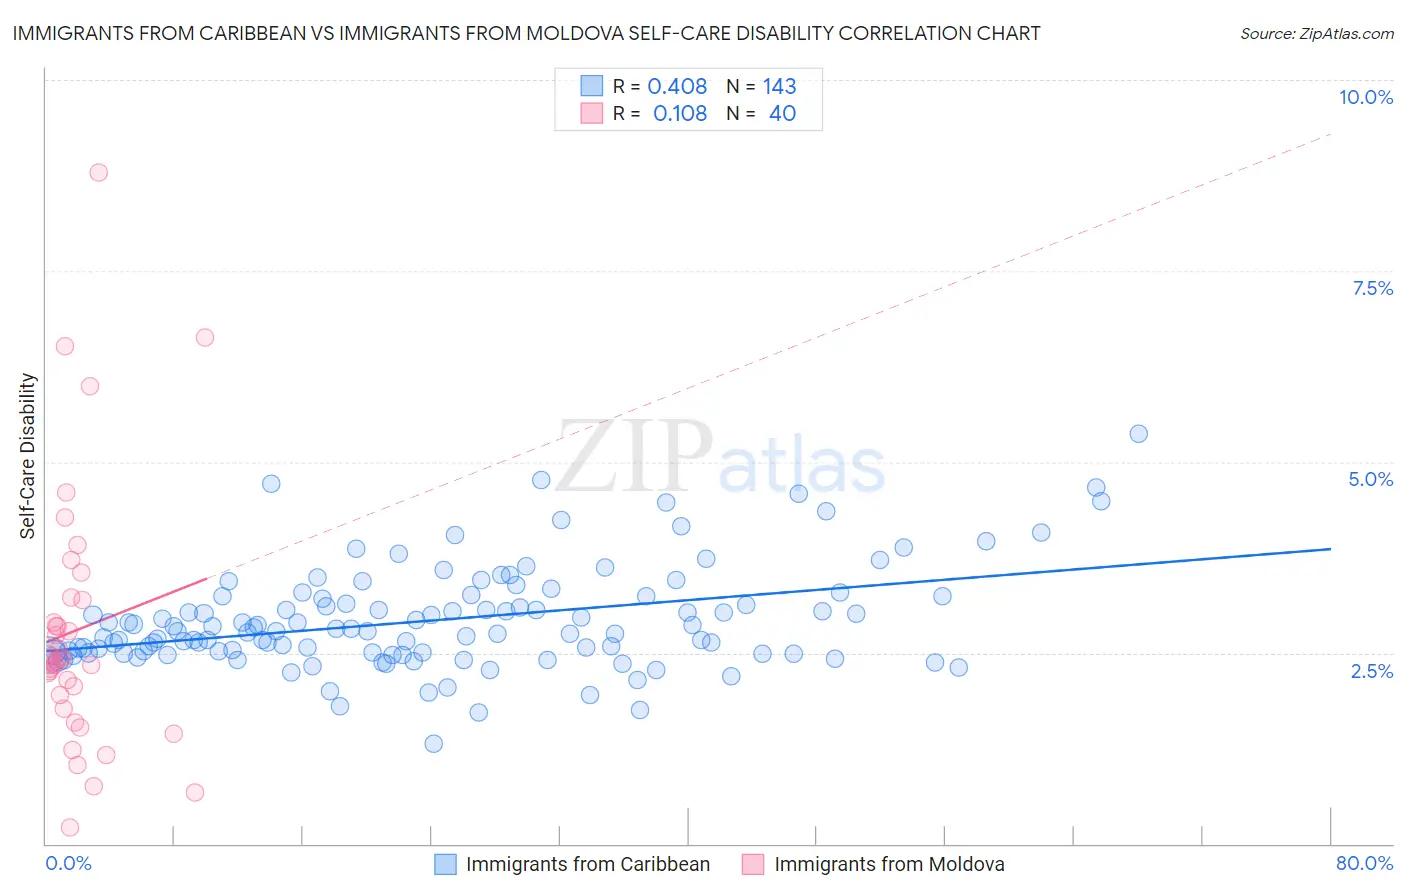
Immigrants from Caribbean vs Immigrants from Moldova Self-Care Disability Correlation Chart
The statistical analysis conducted on geographies consisting of 449,223,668 people shows a moderate positive correlation between the proportion of Immigrants from Caribbean and percentage of population with self-care disability in the United States with a correlation coefficient (R) of 0.408 and weighted average of 2.8%. Similarly, the statistical analysis conducted on geographies consisting of 124,345,596 people shows a poor positive correlation between the proportion of Immigrants from Moldova and percentage of population with self-care disability in the United States with a correlation coefficient (R) of 0.108 and weighted average of 2.6%, a difference of 10.5%.
Self-Care Disability Correlation Summary
| Measurement | Immigrants from Caribbean | Immigrants from Moldova |
| Minimum | 1.3% | 0.22% |
| Maximum | 5.4% | 8.8% |
| Range | 4.1% | 8.6% |
| Mean | 2.9% | 2.8% |
| Median | 2.8% | 2.4% |
| Interquartile 25% (IQ1) | 2.5% | 1.9% |
| Interquartile 75% (IQ3) | 3.2% | 3.2% |
| Interquartile Range (IQR) | 0.74% | 1.4% |
| Standard Deviation (Sample) | 0.67% | 1.7% |
| Standard Deviation (Population) | 0.66% | 1.7% |
Similar Demographics by Self-Care Disability
Demographics Similar to Immigrants from Caribbean by Self-Care Disability
In terms of self-care disability, the demographic groups most similar to Immigrants from Caribbean are Spanish American (2.8%, a difference of 0.030%), Puget Sound Salish (2.8%, a difference of 0.19%), Creek (2.8%, a difference of 0.25%), British West Indian (2.8%, a difference of 0.26%), and Bangladeshi (2.8%, a difference of 0.36%).
| Demographics | Rating | Rank | Self-Care Disability |
| Immigrants | West Indies | 0.0 /100 | #305 | Tragic 2.8% |
| Aleuts | 0.0 /100 | #306 | Tragic 2.8% |
| Natives/Alaskans | 0.0 /100 | #307 | Tragic 2.8% |
| Immigrants | Grenada | 0.0 /100 | #308 | Tragic 2.8% |
| Bangladeshis | 0.0 /100 | #309 | Tragic 2.8% |
| British West Indians | 0.0 /100 | #310 | Tragic 2.8% |
| Puget Sound Salish | 0.0 /100 | #311 | Tragic 2.8% |
| Immigrants | Caribbean | 0.0 /100 | #312 | Tragic 2.8% |
| Spanish Americans | 0.0 /100 | #313 | Tragic 2.8% |
| Creek | 0.0 /100 | #314 | Tragic 2.8% |
| Immigrants | Cuba | 0.0 /100 | #315 | Tragic 2.8% |
| Menominee | 0.0 /100 | #316 | Tragic 2.8% |
| Immigrants | Dominica | 0.0 /100 | #317 | Tragic 2.8% |
| Assyrians/Chaldeans/Syriacs | 0.0 /100 | #318 | Tragic 2.8% |
| Spanish American Indians | 0.0 /100 | #319 | Tragic 2.9% |
Demographics Similar to Immigrants from Moldova by Self-Care Disability
In terms of self-care disability, the demographic groups most similar to Immigrants from Moldova are Subsaharan African (2.6%, a difference of 0.010%), Scotch-Irish (2.6%, a difference of 0.030%), Honduran (2.6%, a difference of 0.050%), Spaniard (2.6%, a difference of 0.060%), and French Canadian (2.6%, a difference of 0.060%).
| Demographics | Rating | Rank | Self-Care Disability |
| Samoans | 5.1 /100 | #212 | Tragic 2.6% |
| Ecuadorians | 4.7 /100 | #213 | Tragic 2.6% |
| Immigrants | Honduras | 4.7 /100 | #214 | Tragic 2.6% |
| Immigrants | Thailand | 4.5 /100 | #215 | Tragic 2.6% |
| Whites/Caucasians | 4.4 /100 | #216 | Tragic 2.6% |
| Celtics | 4.4 /100 | #217 | Tragic 2.6% |
| Scotch-Irish | 4.1 /100 | #218 | Tragic 2.6% |
| Immigrants | Moldova | 4.0 /100 | #219 | Tragic 2.6% |
| Sub-Saharan Africans | 4.0 /100 | #220 | Tragic 2.6% |
| Hondurans | 3.8 /100 | #221 | Tragic 2.6% |
| Spaniards | 3.8 /100 | #222 | Tragic 2.6% |
| French Canadians | 3.8 /100 | #223 | Tragic 2.6% |
| Osage | 3.6 /100 | #224 | Tragic 2.6% |
| Iraqis | 3.2 /100 | #225 | Tragic 2.6% |
| Chinese | 2.9 /100 | #226 | Tragic 2.6% |